Highlights
I worked with Nathan during research stint at the Centre and found him highly motivated and enterprising. He gamely took on the challenge of helping to develop new methodologies and delivers beyond what was expected for a young undergrad researcher. Nathan was highly responsible, detailed and adaptable, and worked very well with the rest of the cross disciplinary team. I truly appreciated the time he spent with us.
-Samuel Chng, Senior Research Fellow at LKYCIC
Overview
Strengthening Urban Resilience in the age of Fragmentation (SURF) is a research project kickstarted by the Lee Kuan Yew Centre for Innovative Cities (LKYCIC). The project aims to inform policymakers on (1) the likely impacts and tradeoffs when different transport electrification policies are implemented, and (2) the limits and potential of improving urban infrastructures that aim to encourage walking.
As an Undergraduate Research Assistant under the Undergraduate Research Opportunity Programme (UROP) scheme, my role was to aid the team in developing new methodologies to collect and analyze data to complete the research. The following tasks were completed throughout my stint working with the team.
Learn more about the project here:
Strengthening Urban Resilience in the Age of Fragmentation
lkyspp.nus.edu.sg
GitHub repository for SURF project
github.com
Scraping Traffic Data
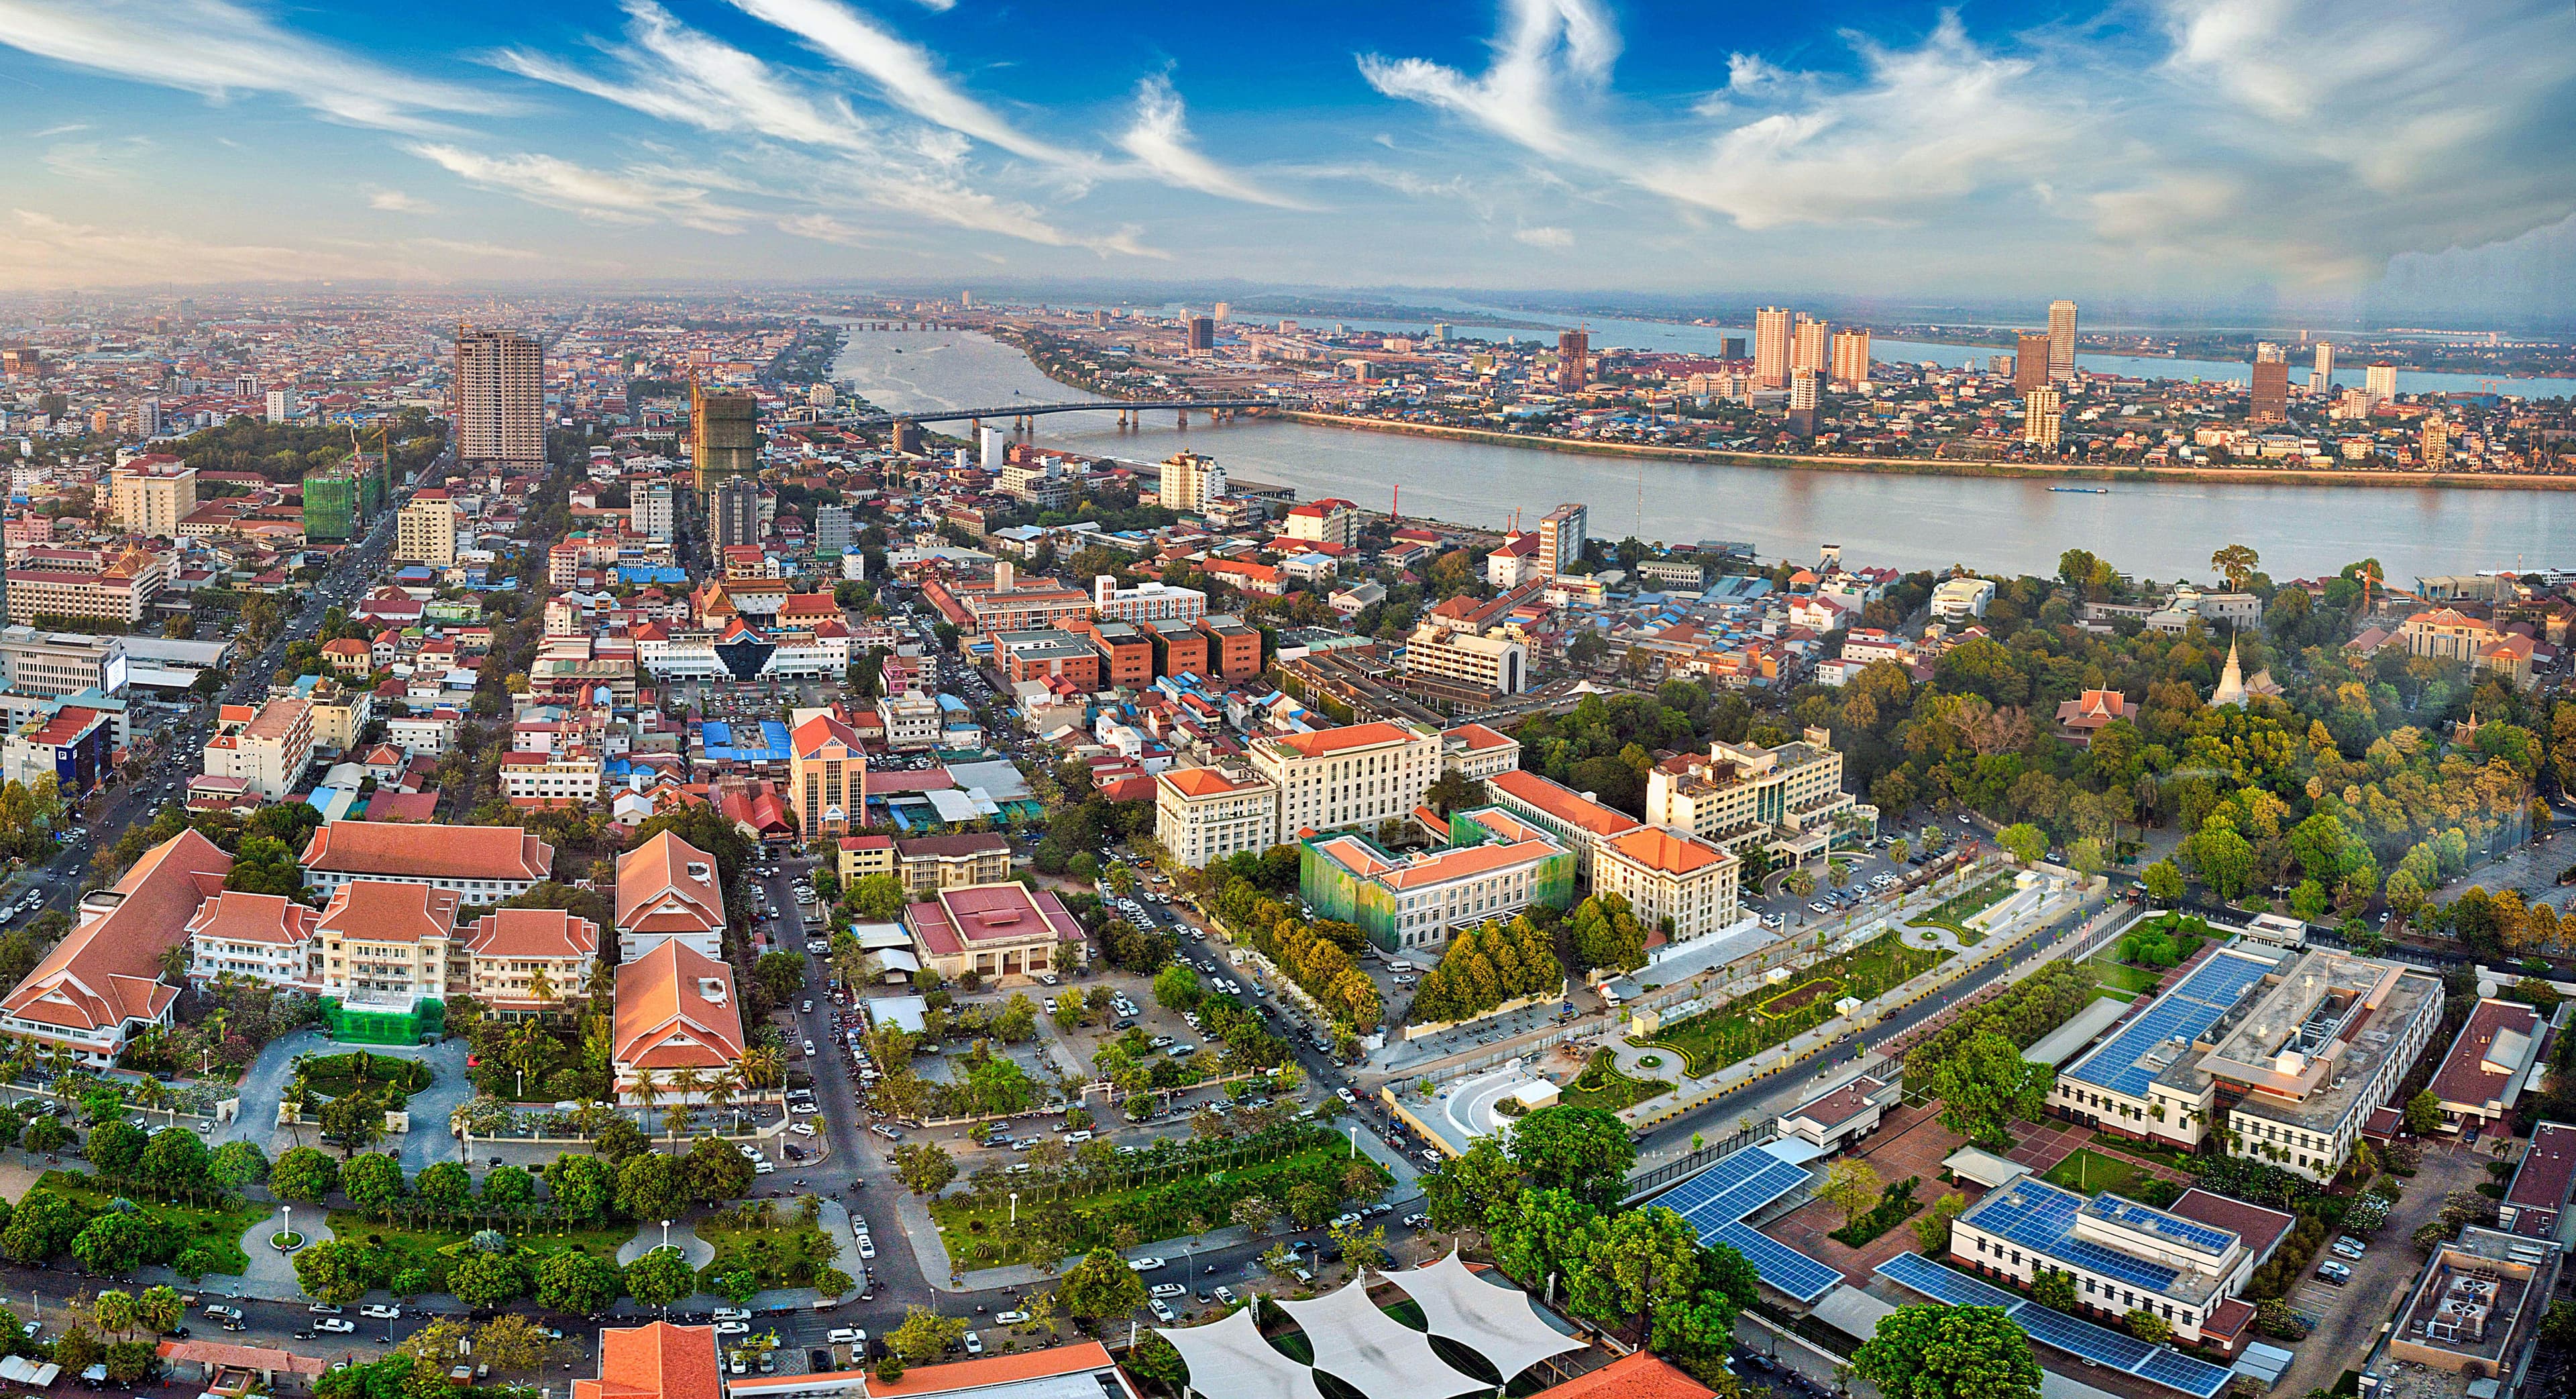
The research team needed to extract useful traffic data to perform their analysis. My task was to scrape rush hour traffic data from the web for the city Phnom Penh (our area of research).
To solve this task, I built a browser automation pipeline in Python using Selenium to programmatically drive a headless Chrome instance. The pipeline navigates a map web application, injecting the target coordinates for each road segment and capturing rendered map tiles as image frames.
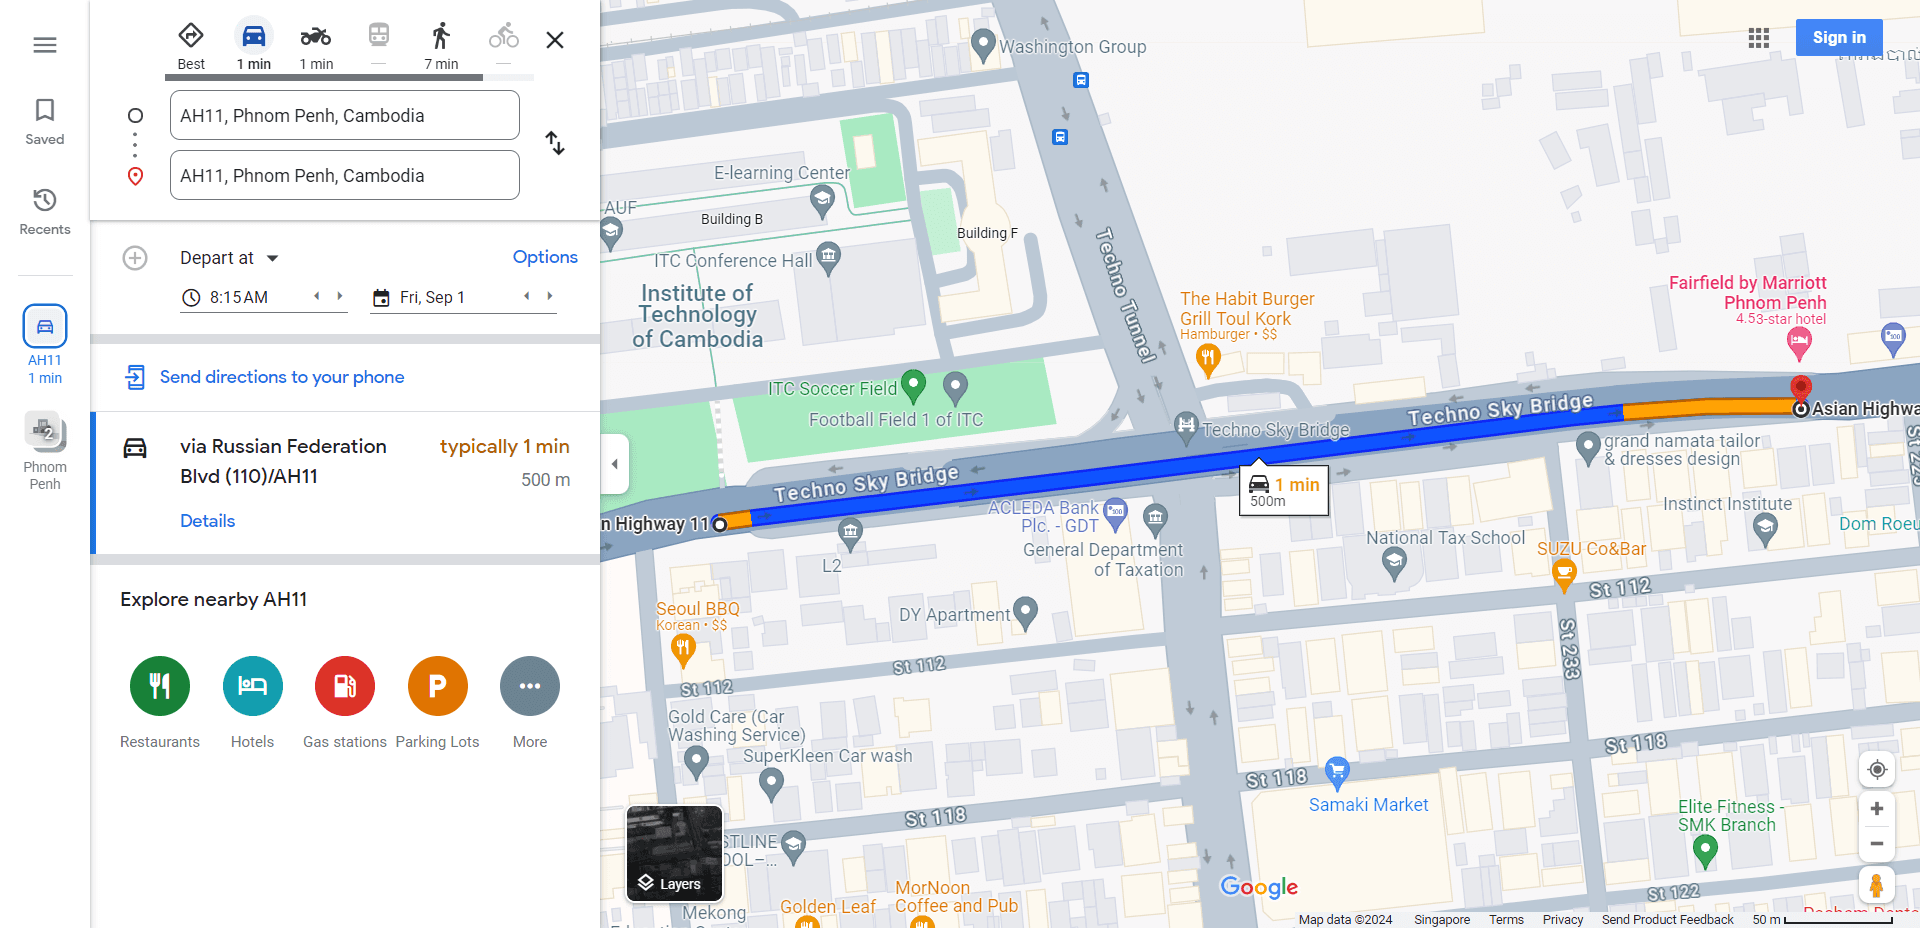
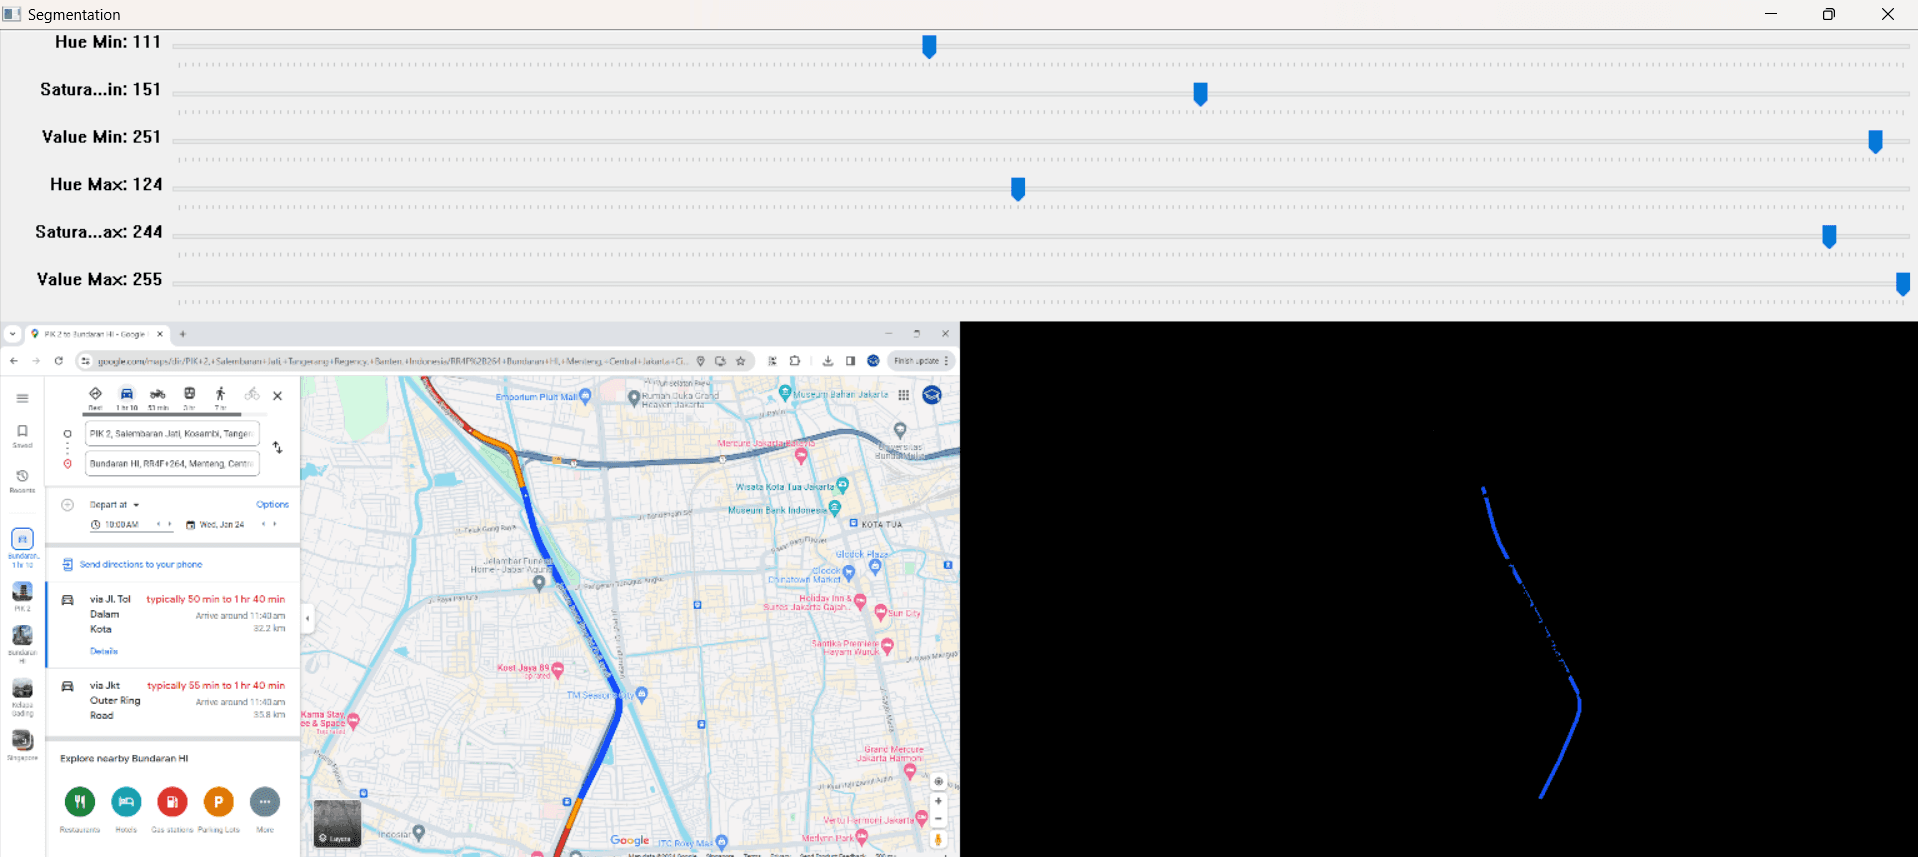
The program then analyzes the color-coded road network and extracts useful traffic information from it. The road network is color coded using unique colors according to traffic levels (blue for best traffic and dark red for worst traffic). Using cv2, we can identify what range of HSV values represent a certain traffic level, and this information was used to extract useful traffic data. I created a feature which enabled users to select a range of HSV values and a color filter will segment the image according to the given range of HSV values.
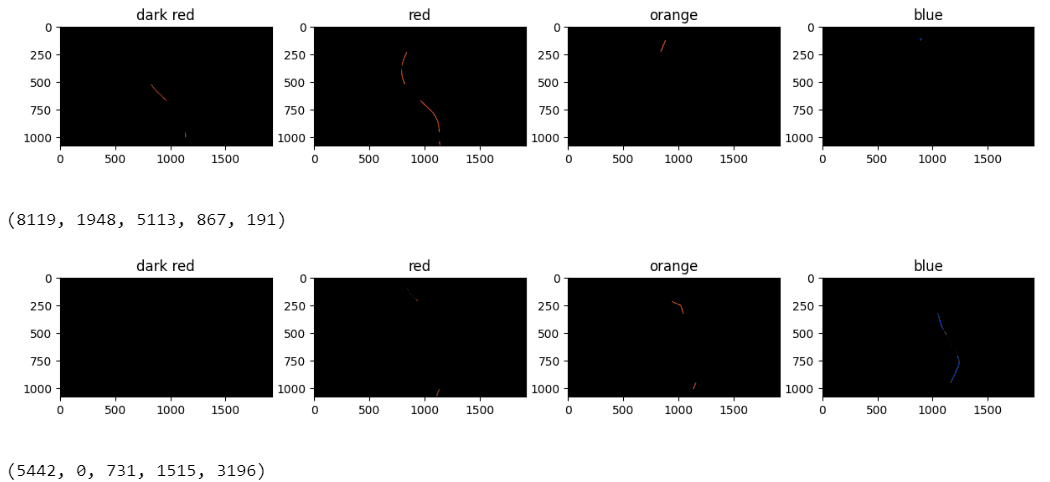
At scale, this pipeline captured and processed approximately 7,200 images per hour, generating roughly 6 GB/hour of structured traffic-flow data — enough throughput to support continuous rush-hour monitoring across the studied road network.
Traffic Simulation Machine Learning
The team then needed to develop a simulation which models the daily movement of 2,000,000 Phnom Penh residents and the medium of transportation used in their travels. This was a challenging task as we needed to consider various factors that may affect a commuter's choice of medium transportation.
To solve this task, I implemented several machine learning techniques including K-means clustering, which struggled to capture the continuous, overlapping nature of commuter movement patterns, and kernel density estimation (KDE), which better modeled the underlying probability density function of a certain probability distribution. KDE proved to be the more powerful technique here, as it is able to capture not only univariate distributions but also multivariate ones.
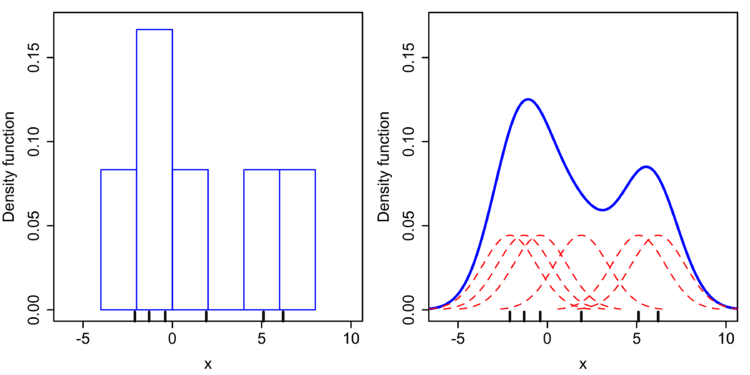

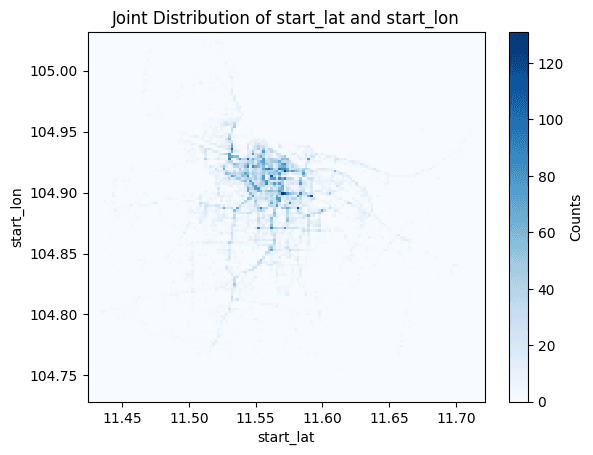
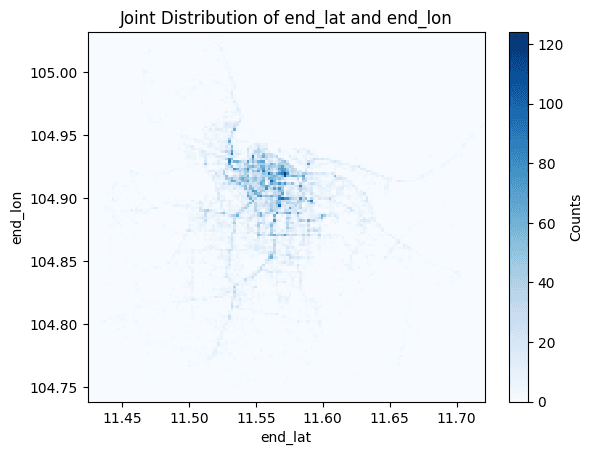
To simulate the daily movements of Phnom Penh residents, we analyzed anonymized location data which has been collected by another party. The dataset consisted of 44,000 sample data points detailing the starting and ending locations of individuals throughout the day, their travel durations, speeds, and start times of their journeys.
As this dataset is a multivariate distribution, we can simply use the KDE to estimate its joint probability distribution function. Afterwards, we utilized the joint pdf generated through the KDE to simulate the movements of 2,000,000 Phnom Penh residents.
Impact
The mobility simulation and traffic-flow datasets generated through this work fed directly into LKYCIC's policy analysis on transport electrification and walkability — helping quantify tradeoffs that inform sustainable urban transit planning for Phnom Penh.