This is a course project for 40.015 Simulation Modelling and Analysis. It models a scenario inspired by Changi General Hospital's public robot deployment and does not represent CGH or use CGH data.
Overview
Singapore's healthcare system faces a structural nursing shortage driven by rapid population ageing, rising chronic disease burden, and persistent workforce attrition rooted in excessive workload. To address this problem, Changi General Hospital deployed three autonomous mobile robots in its Emergency Department in July 2023: MEDi (medication transport), BLANKi (comfort items), and EDi (visitor escort). The robots were designed to offload non-clinical errands from nurses so that they can focus on clinical work.
But does a human-robot hybrid model produce statistically significant, system-level improvements in patient outcomes, or merely local efficiencies that dissolve once the ward is considered as a whole?
This simulation answers that question by running a discrete-time ABM of a 48-bed ward under two conditions: Scenario A (nurses only) and Scenario B (same nurses plus a configurable robot fleet). Because both scenarios share Common Random Numbers, outcomes are compared across 30 paired replications using paired -tests with a Holm–Bonferroni correction.
Source code, model documentation, and output analysis
Vanilla-JS simulation engine (Pixi.js rendering, seeded LCG PRNG), Node sweep harness, and the full Python analysis pipeline that reproduces every figure below.
github.com
We built an in-browser agent-based simulation with configurable parameters: nurse count, MEDi/BLANKi/EDi fleet size, patient need spawn rates, and the PRNG seed are all live-adjustable through a reactive control panel, with play/pause/step controls to scrub through a shift or watch it unfold in real time.
Scenario A: A hospital ward managed only by nurses.
Scenario B: A hospital ward managed by nurses and robots.
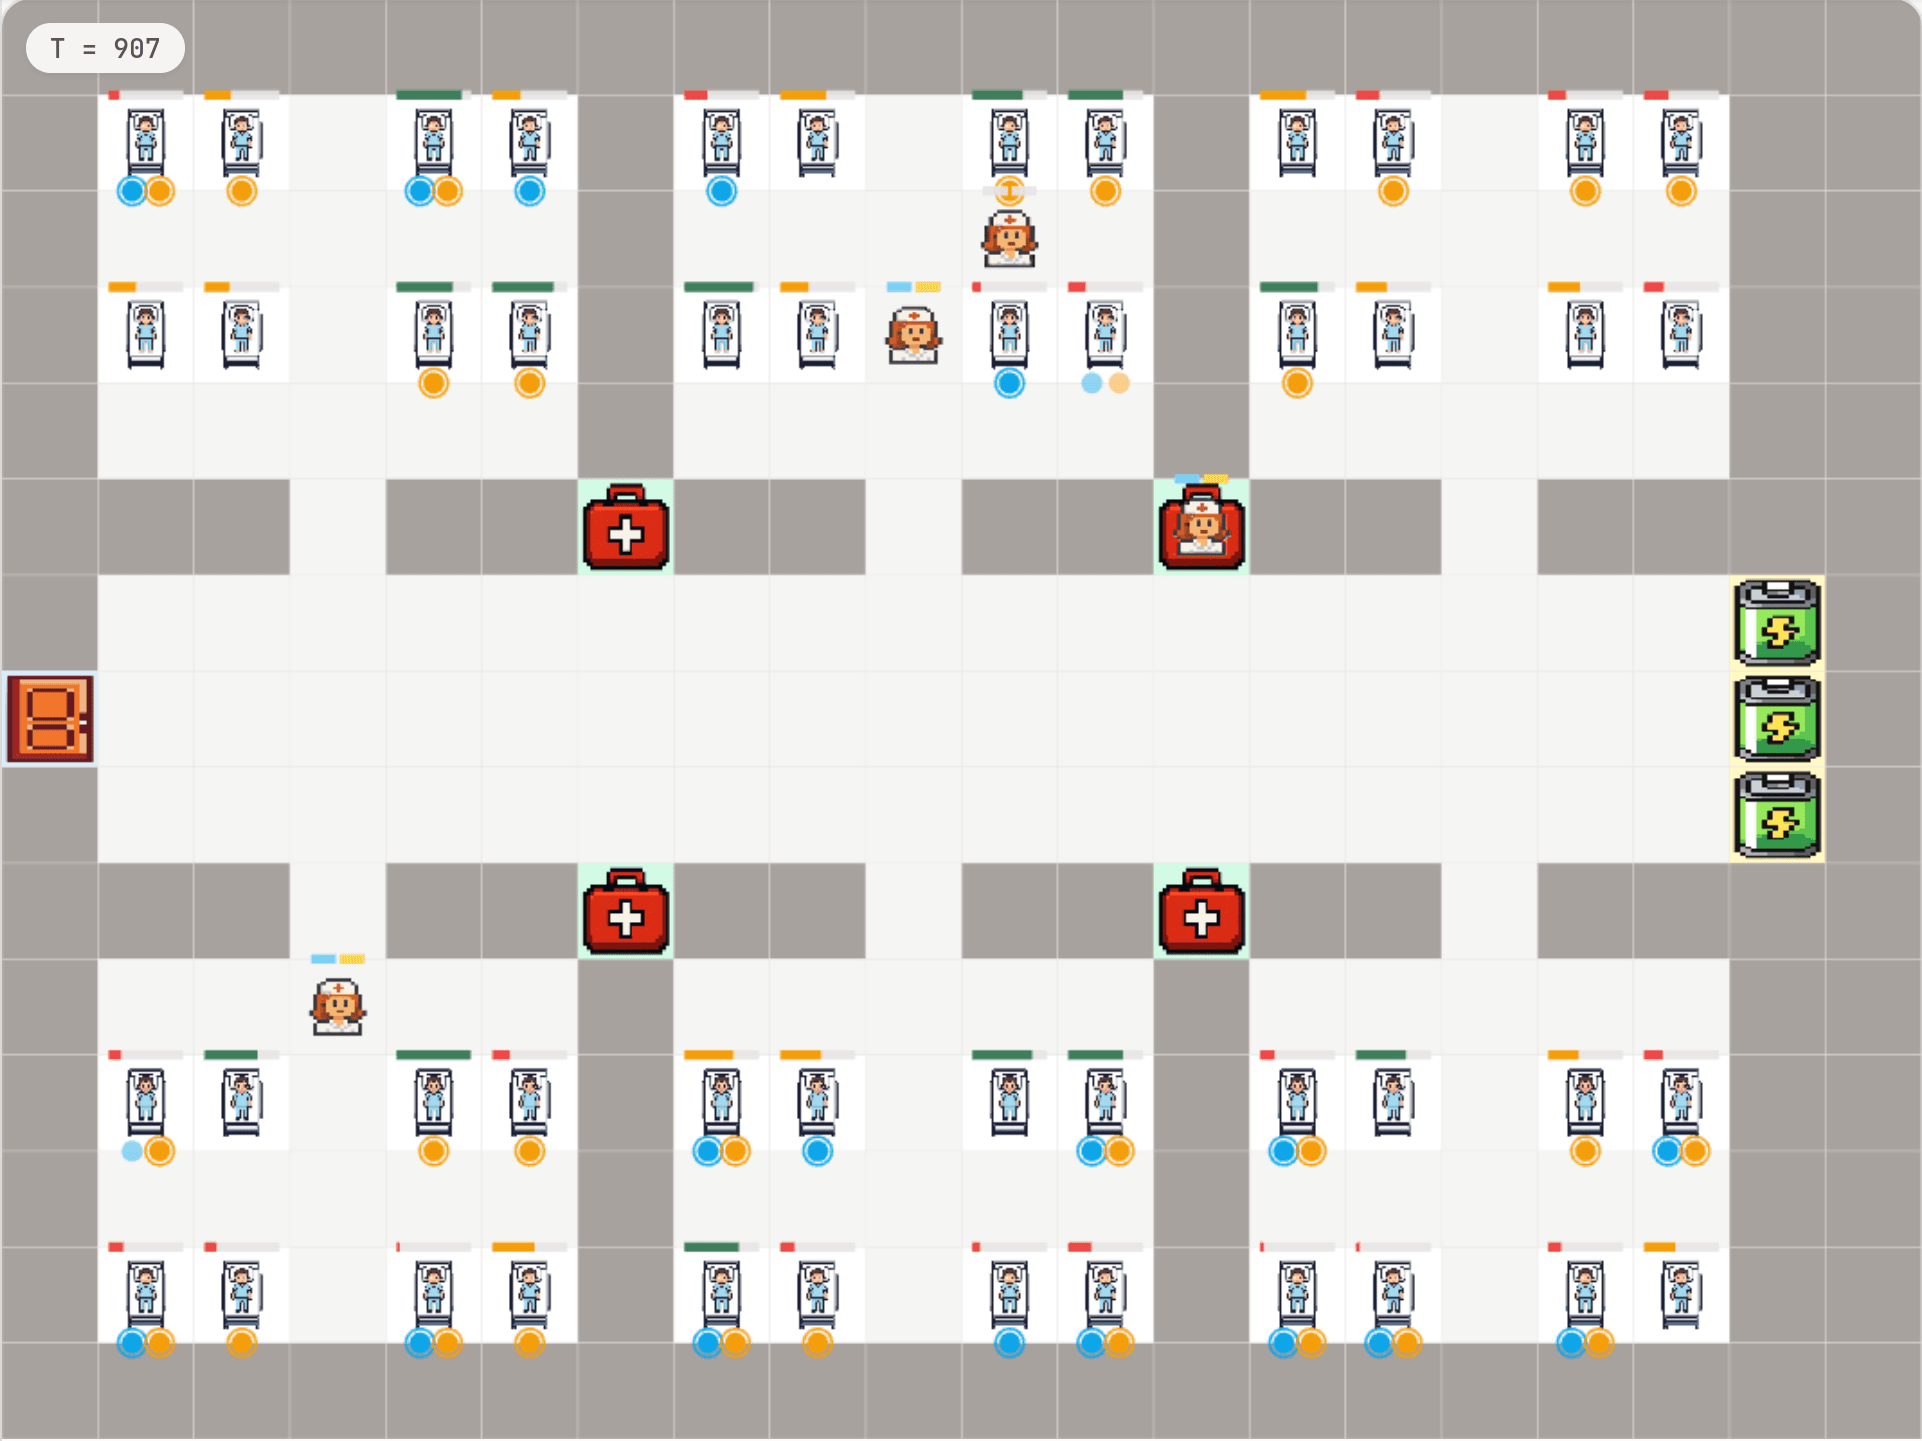
The ward is a 20 × 15 grid: 48 beds in four bays of twelve, 4 nurse stations, 3 charging bays, and a single entrance. One tick is 30 seconds of ward time; one run is 960 ticks, or a single 8-hour nursing shift.
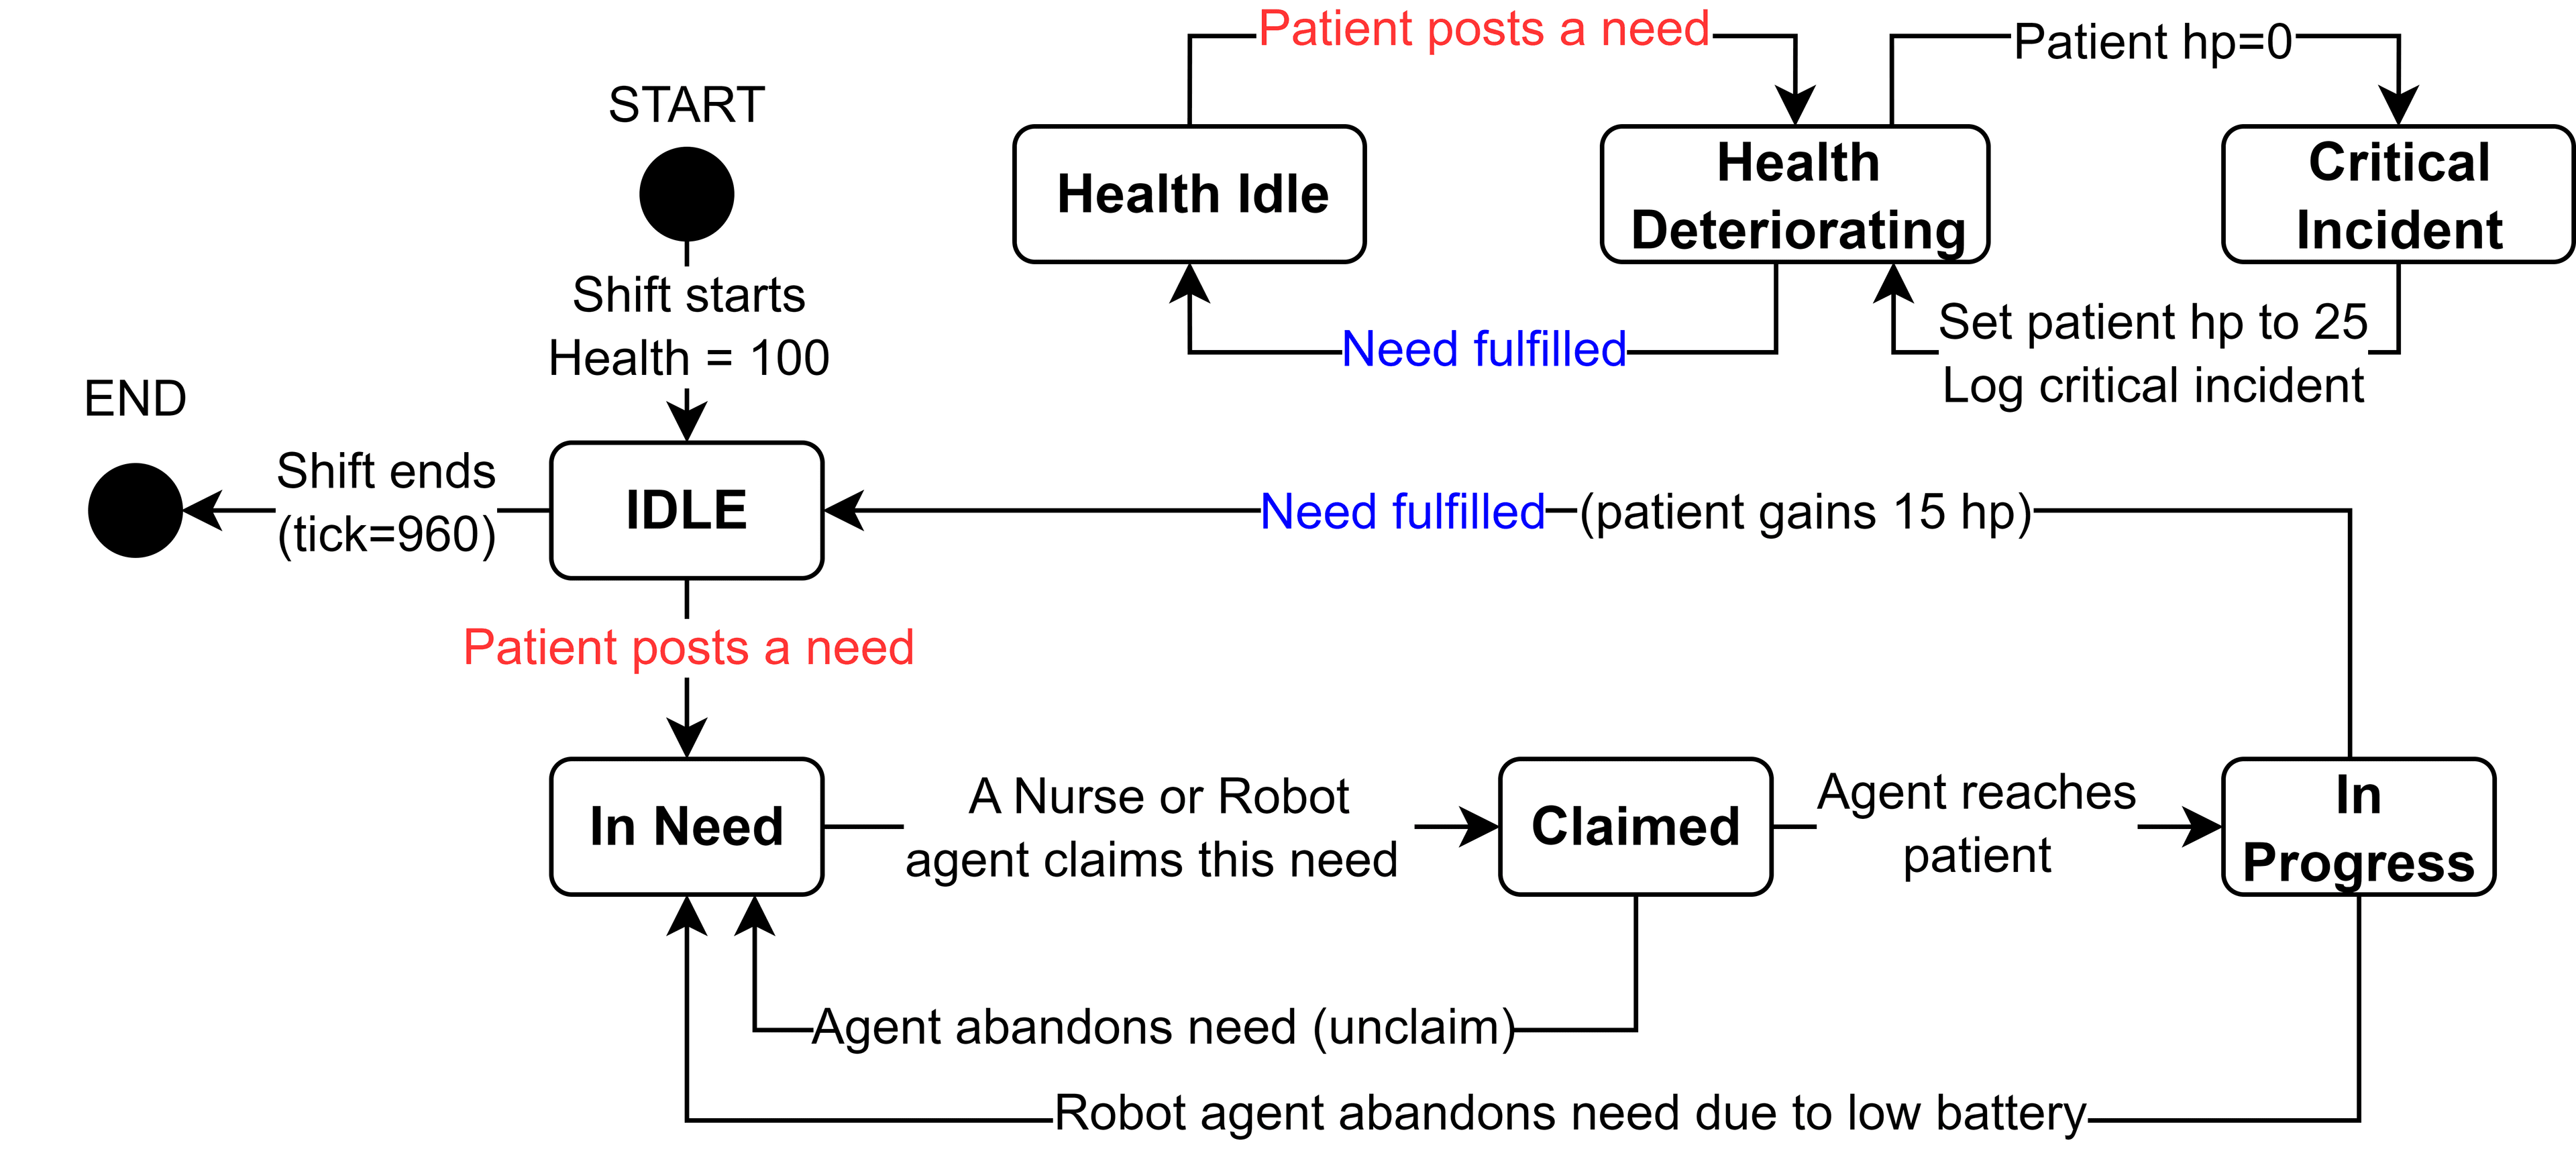
Each tick, every patient independently rolls for four classes of need (emergency, medication, comfort, visitor escort) and posts them to a global NeedQueue. Nurses and robots poll that queue and compete to claim work. Unfulfilled needs drain patient health at type-specific rates; when health hits zero, a critical incident is logged.





Simulation Design
Only nurses can serve emergencies. Robots cannot help patients directly, so any benefit they produce must arrive indirectly, through the nurse capacity they free up.
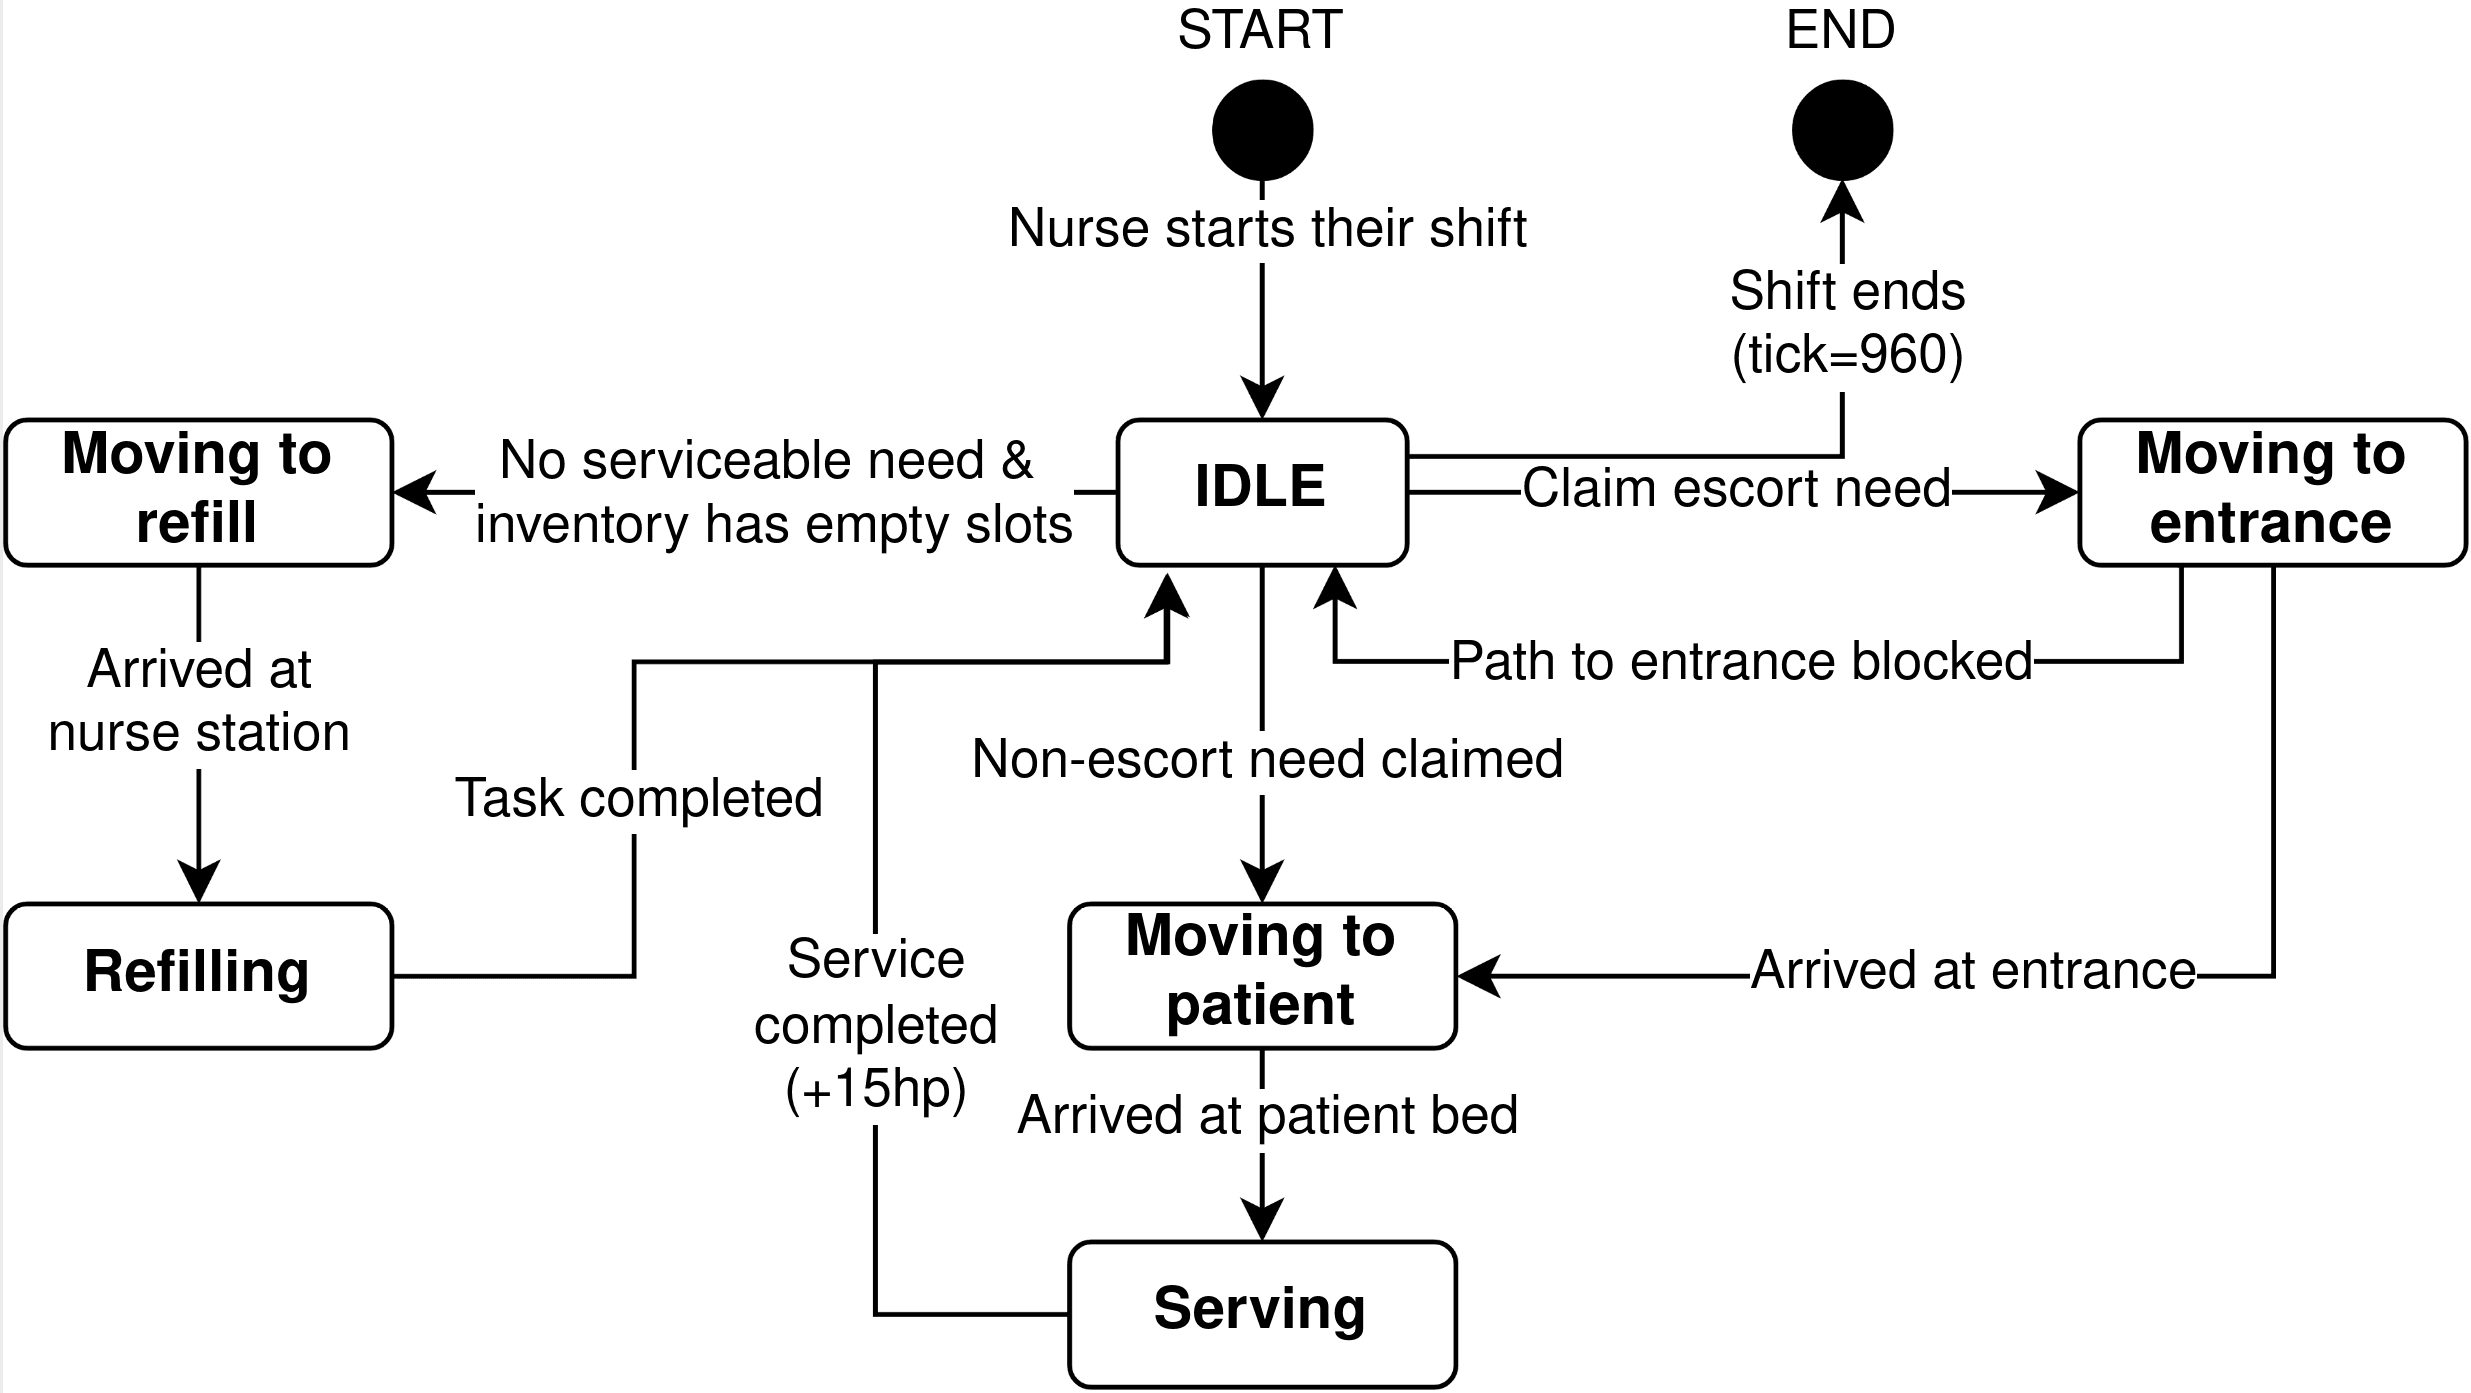
Nurses are generalists and dispatch themselves by scoring every serviceable open need:
which balances urgency ( for emergencies down to for escorts), fairness (needs that have waited longer score higher), and efficiency (closer needs win, all else equal).
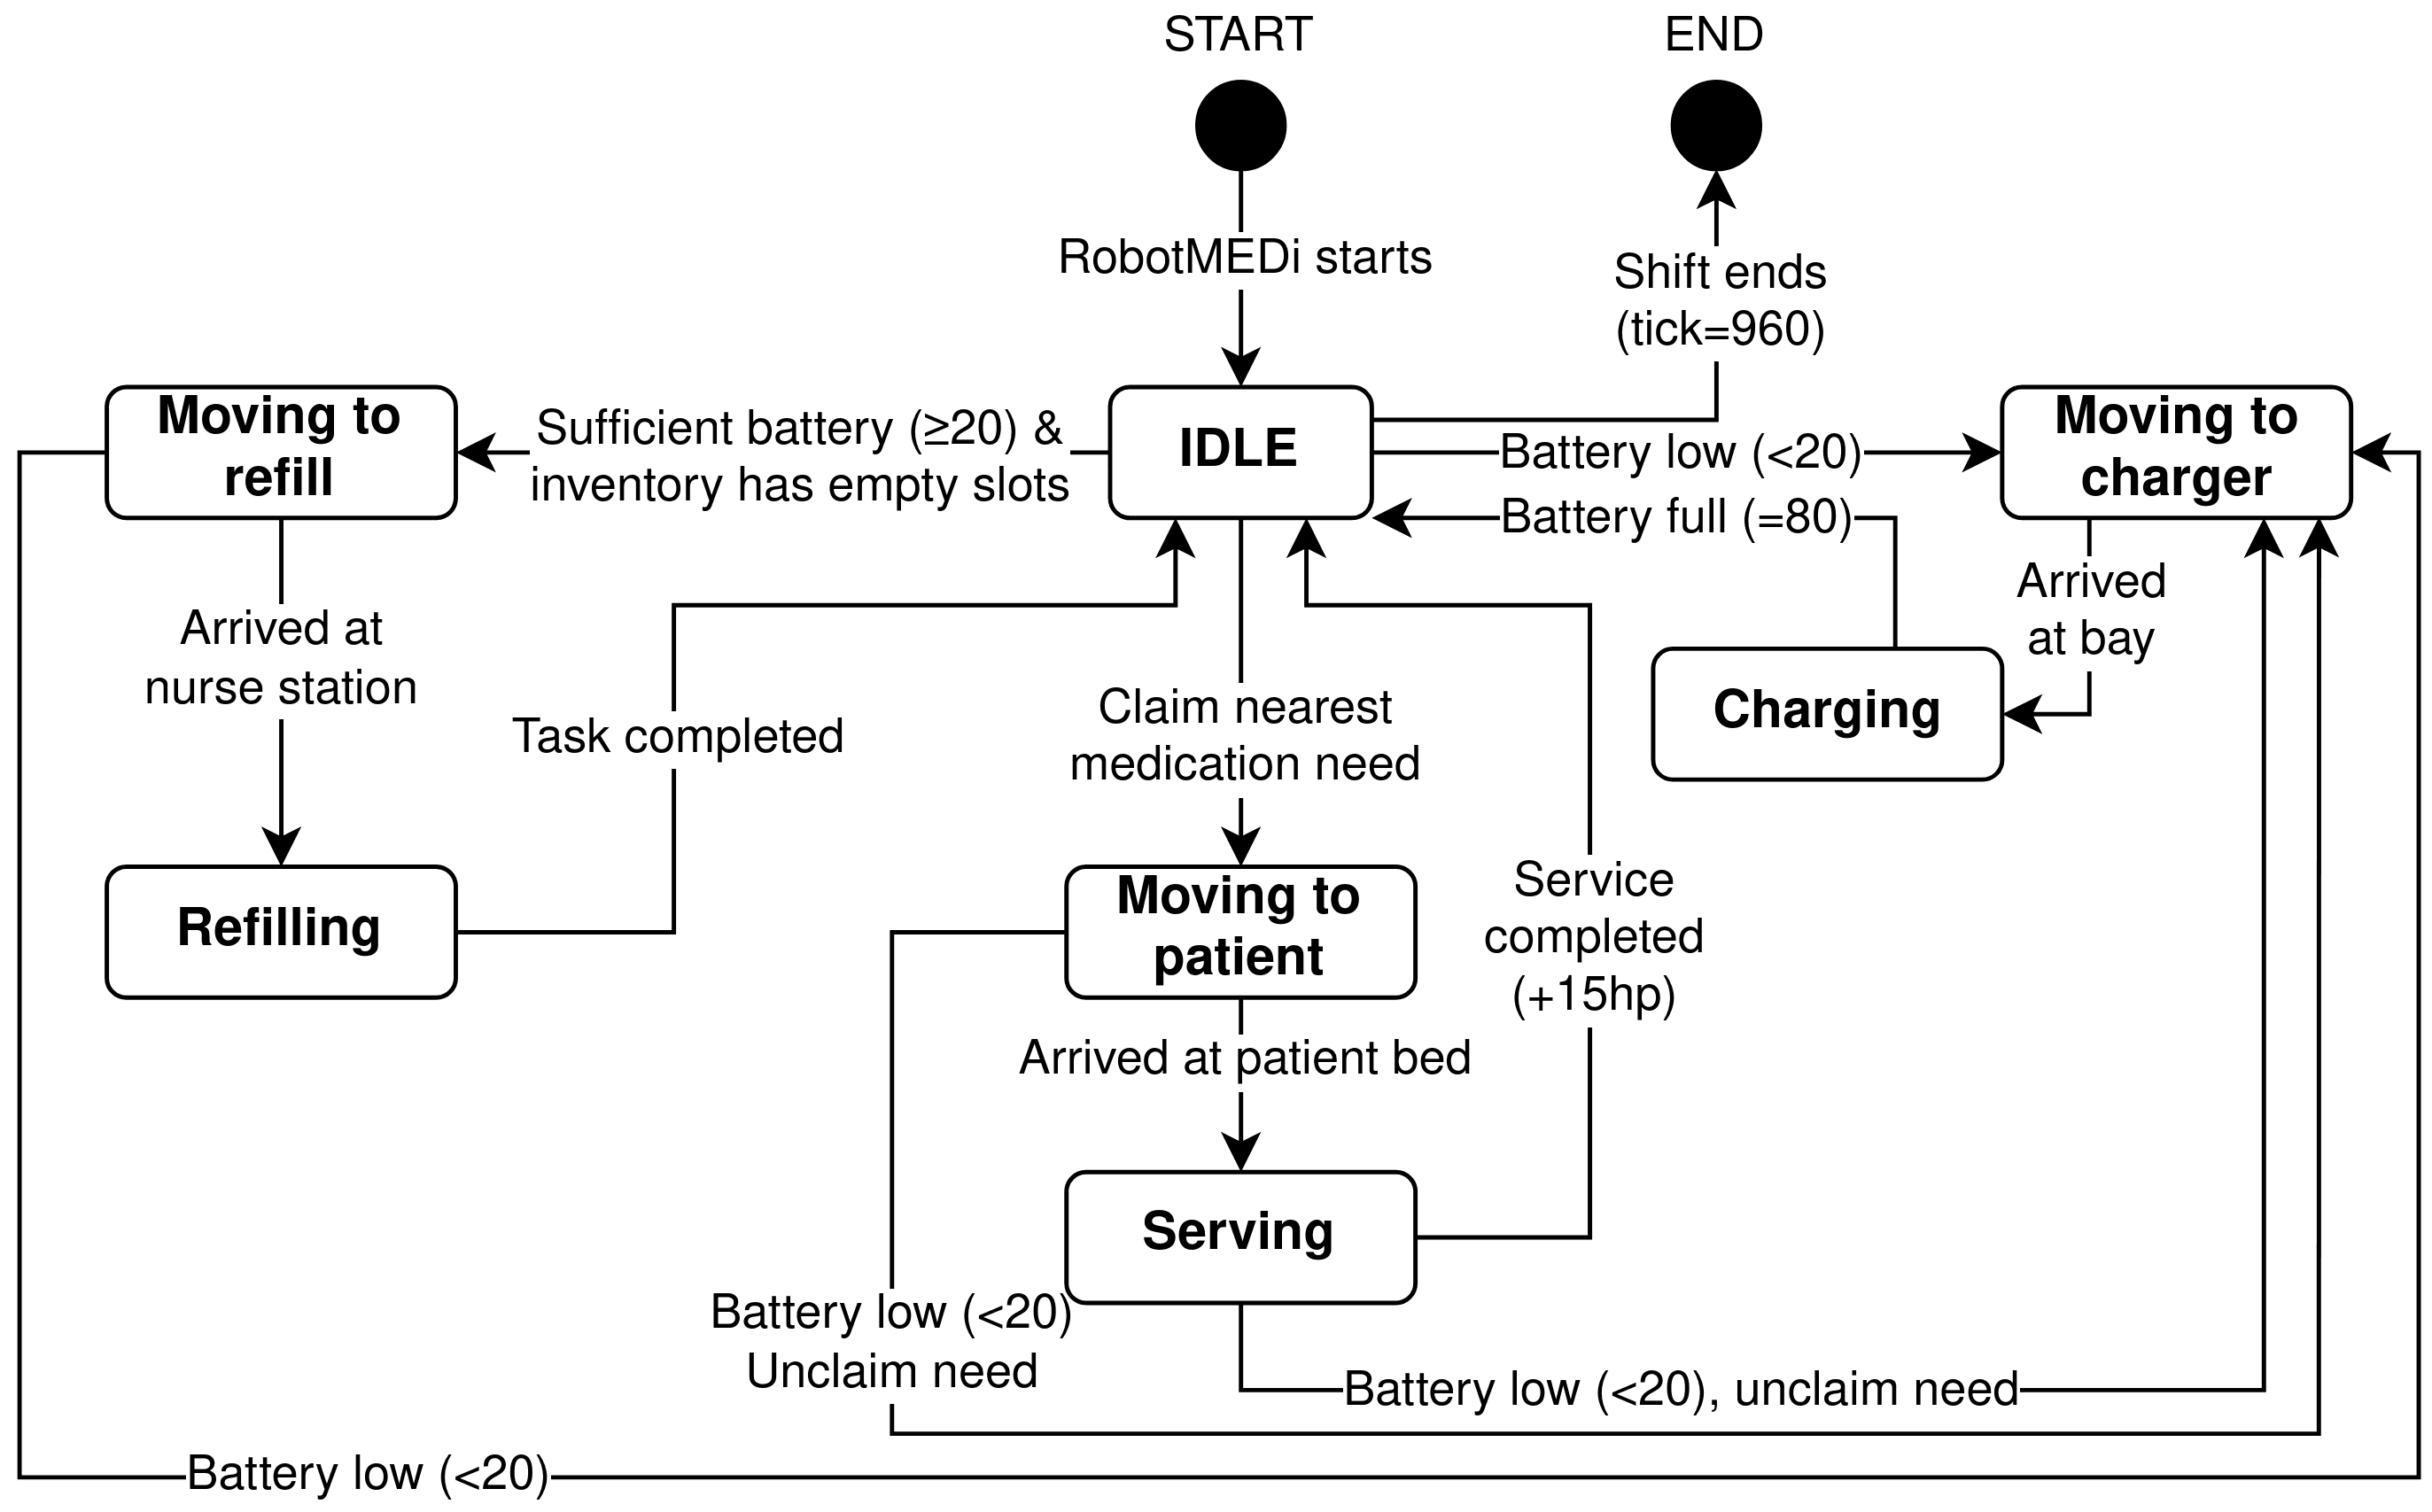
Robots are specialists and use a cheaper nearest-first rule over the single need type they serve, with hard pre-emption below the low-battery threshold (20 of a max 80), the only task interruption anywhere in the model.
Movement uses BFS on the grid; scoring uses Manhattan distance. That is a conscious trade-off, not an oversight: Manhattan is a cheap lower bound on true path length and preserves the relative ordering well enough for a greedy claim, without paying for a BFS per candidate need per idle agent per tick.
Robots decide before nurses, so that in the robot scenario the routine work is skimmed off before nurses look at the queue.
The model is agent-based at its core: all behaviour emerges from the internal state machines of the agents.
Patient and Nurse State Diagrams
Robot State Diagrams
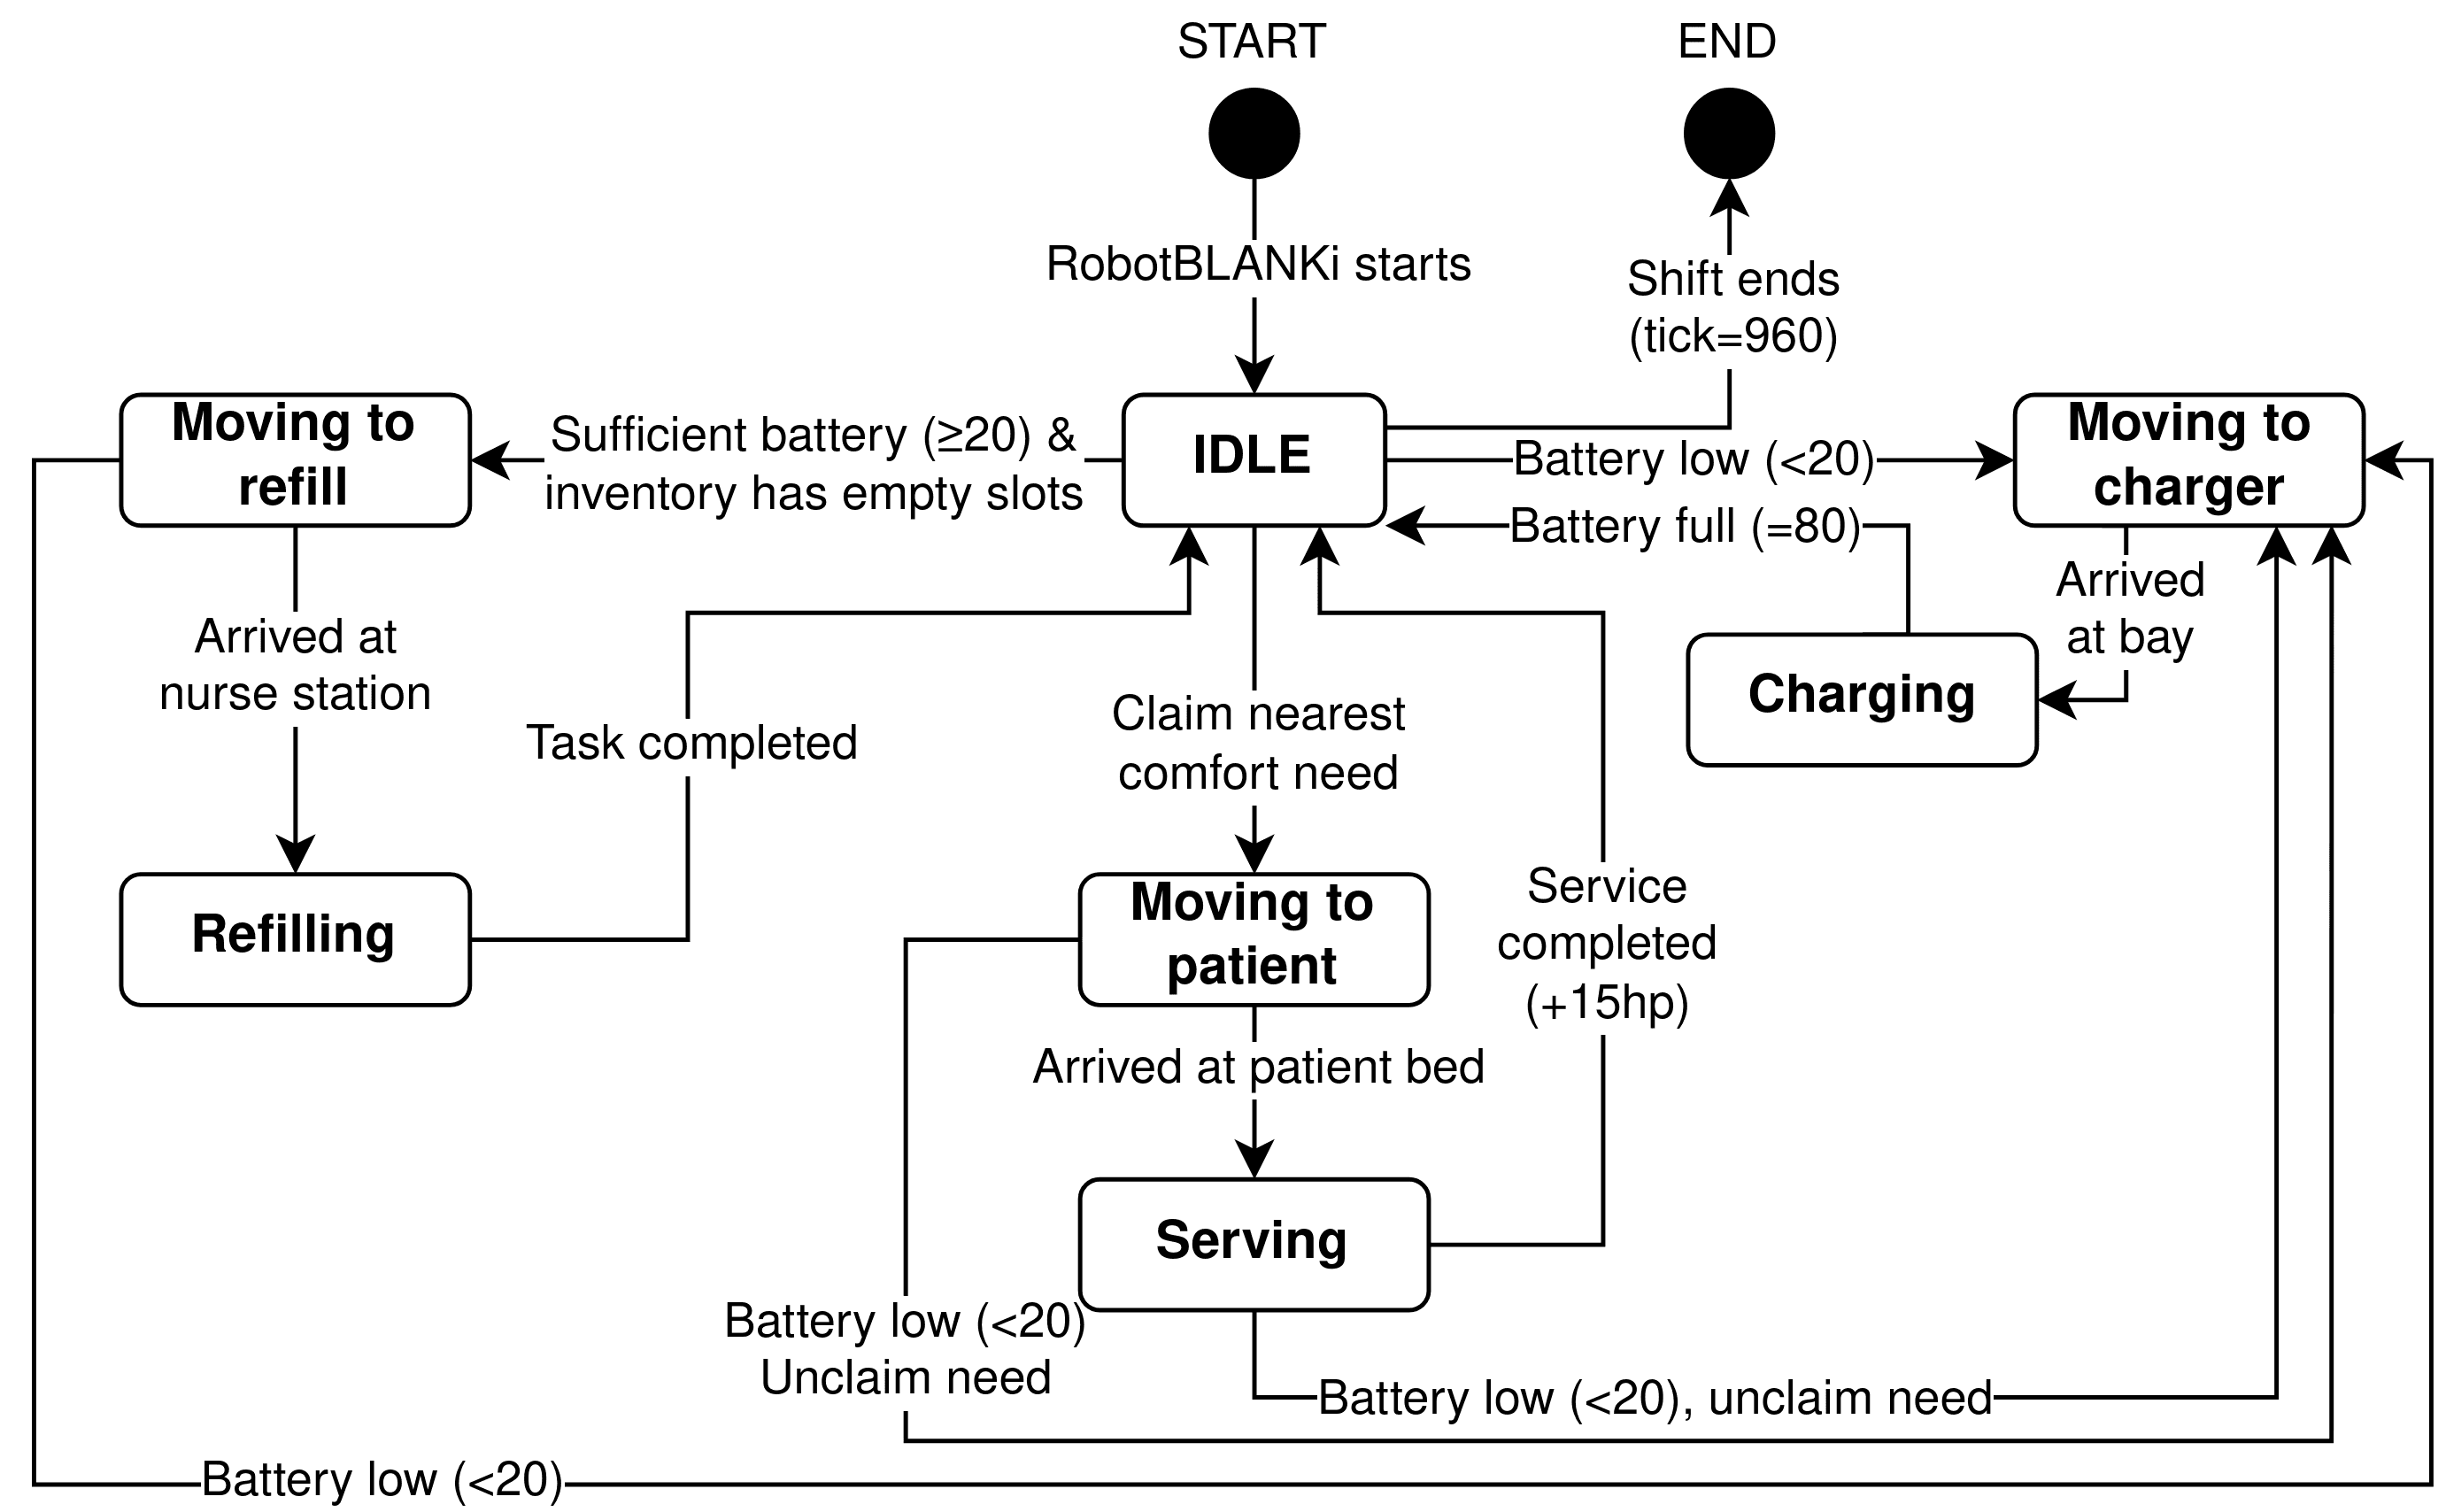
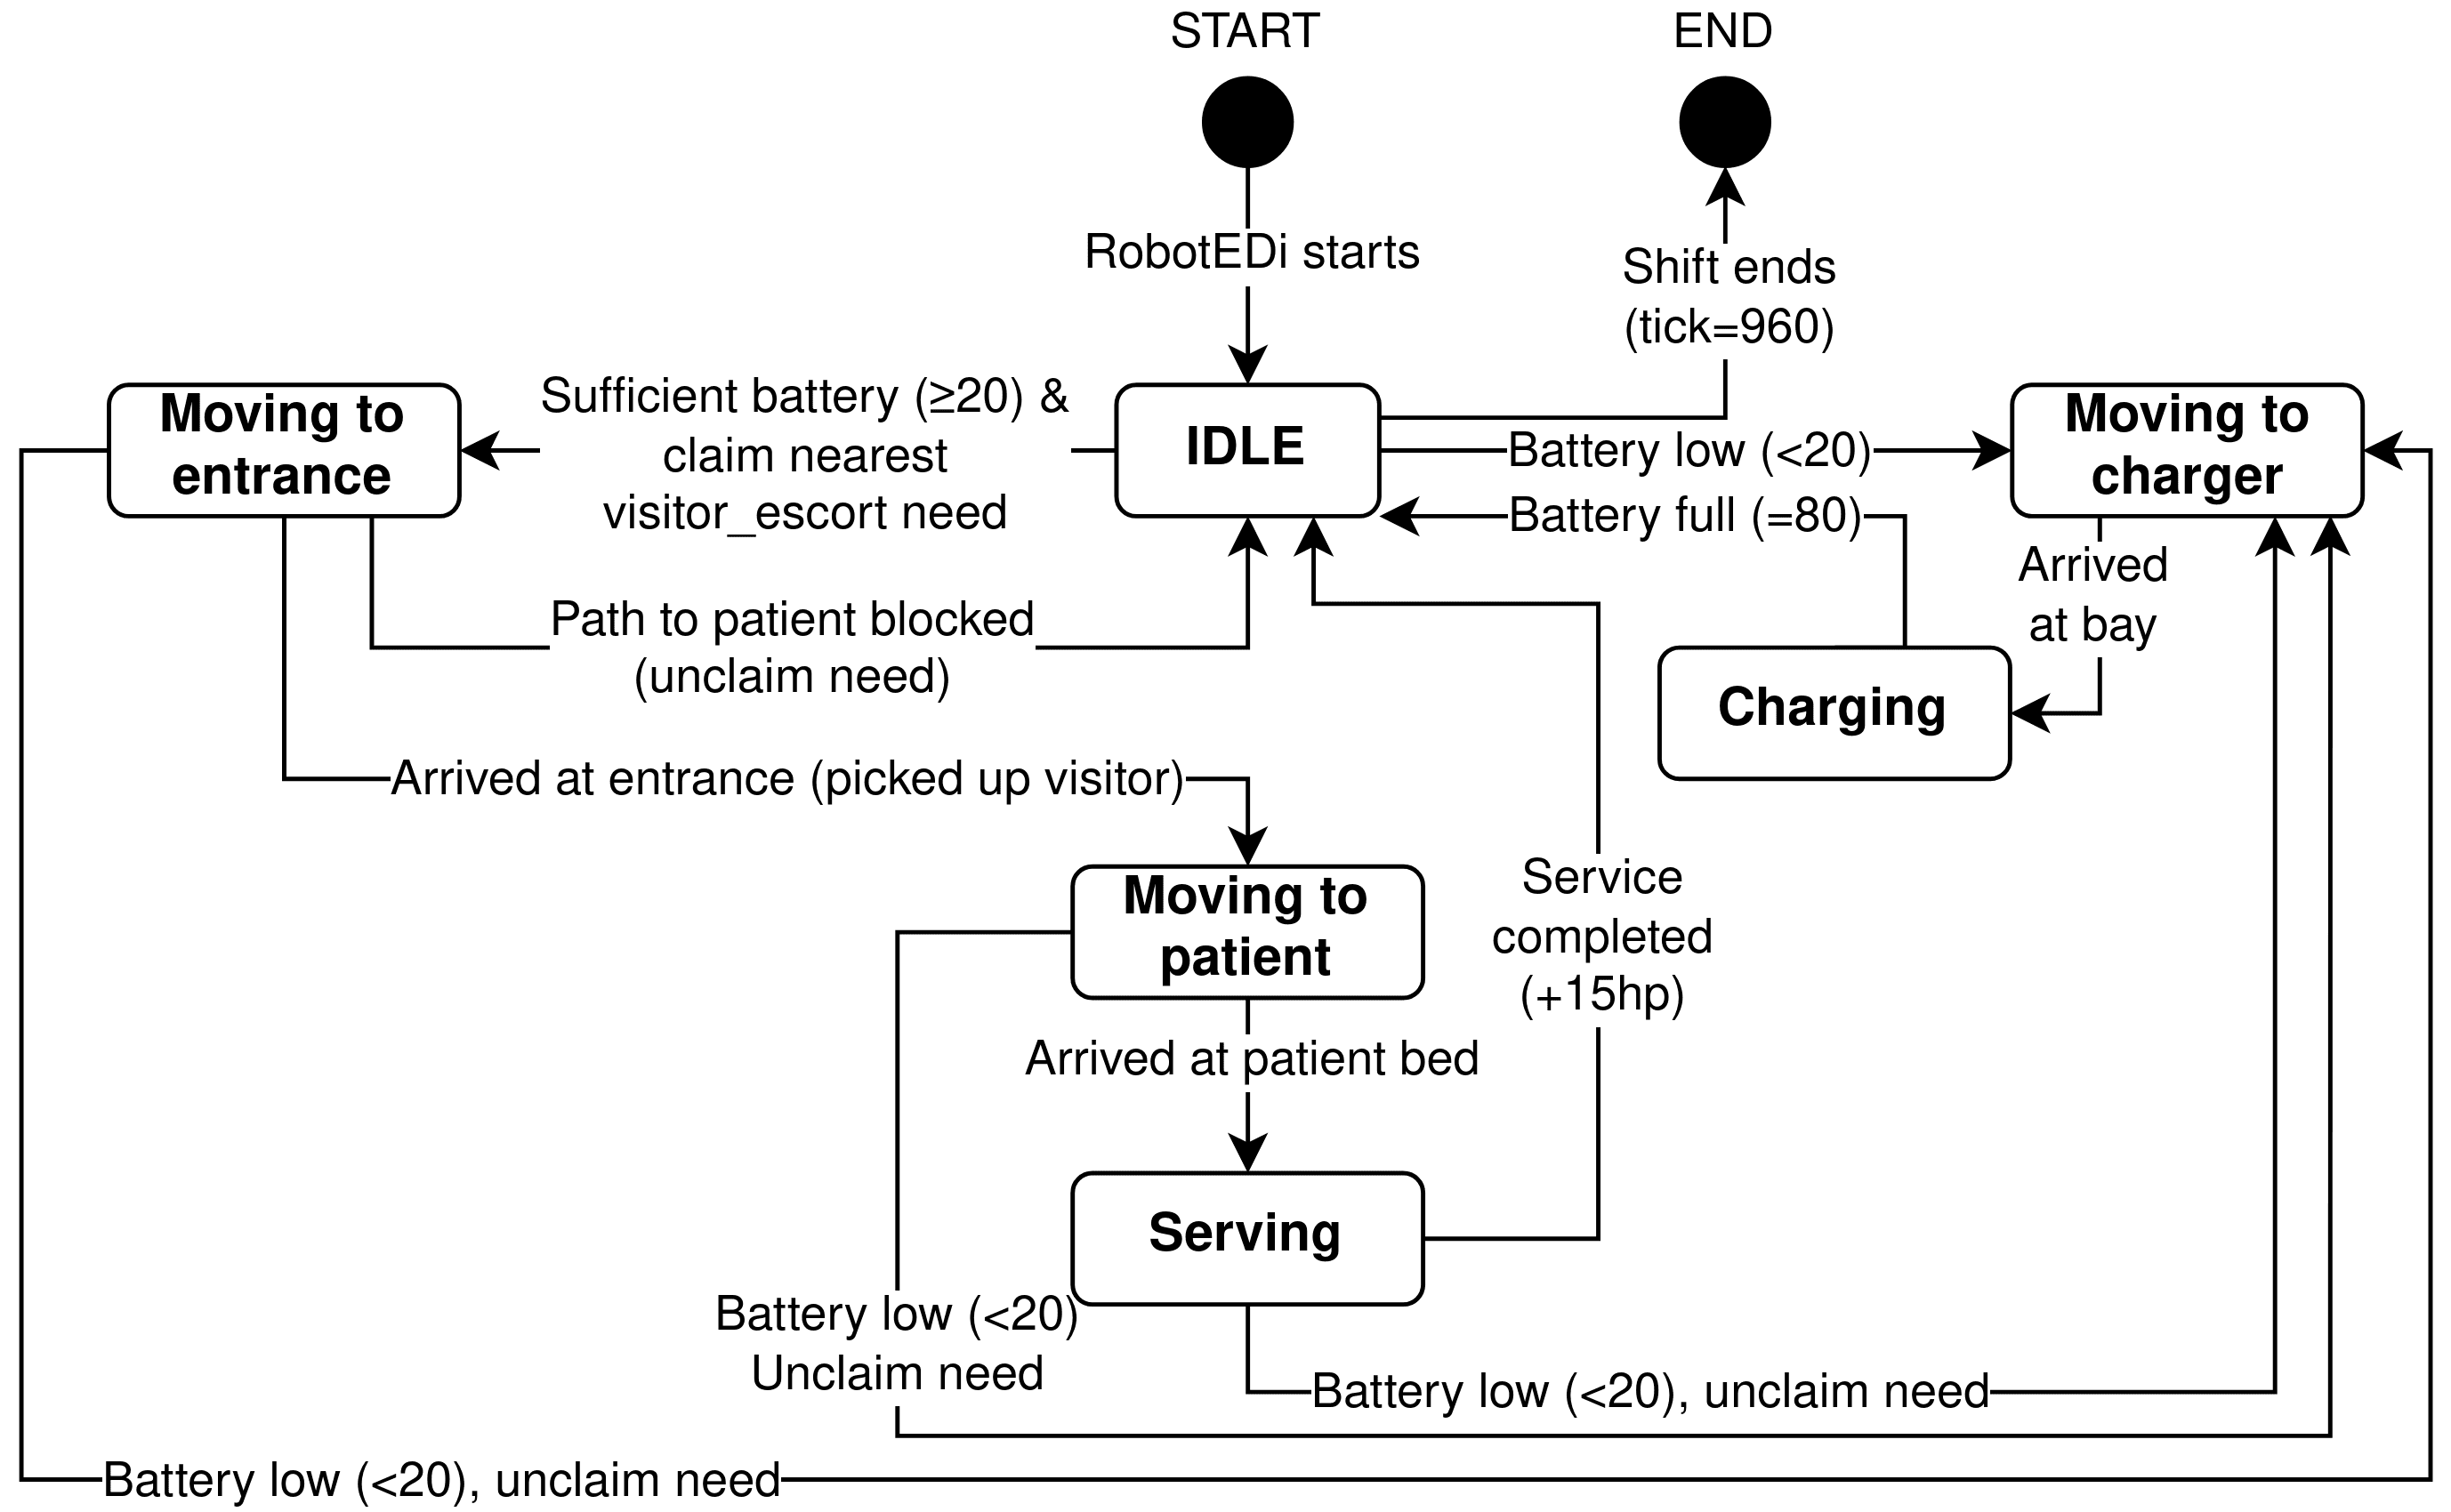
Analysis
Experimental Design
Two scenarios are compared. Scenario A uses the same nurse count as B but zero robots, while Scenario B adds a configurable fleet of MEDi, BLANKi, and EDi robots; the baseline comparison sits at 5 nurses with one robot of each type. Each replication runs 960 ticks (one eight-hour shift), with the first 50 ticks designated as warm-up and excluded from all aggregated KPIs.
Common Random Numbers
Every stochastic draw routes through a seeded linear congruential PRNG, and replications are seeded sequentially (seeds 1-30). Reusing the same seed in both scenarios reproduces the identical patient-arrival sequence, so replication of A and replication of B face the same shift, and the difference between them is attributable to the robots rather than to the luck of the draw. This is a textbook Common Random Numbers (CRN) variance-reduction setup, and the same seeds are reused across every cell of the sweep.
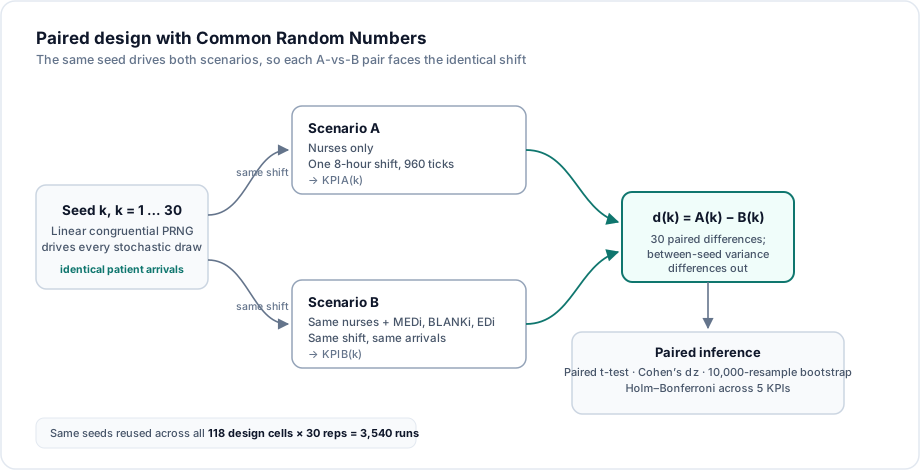
The pairing lets the analysis use a paired -test on , which differences out between-seed variance and reaches significance with 30 replications where an unpaired Welch test would have needed far more.
The Sweep
- Full factorial (108 cells):
NURSE_COUNT∈ 7 ×MEDI∈ 3 ×BLANKI∈ 2 ×EDI∈ 2 - One-at-a-Time supplement (10 cells): medication and emergency spawn rates perturbed to 0.5×, 0.75×, 1×, 1.5×, 2× of the calibrated baseline
- 118 design cells × 30 replications = 3,540 runs, driven by a Node harness and analysed in Python
Primary KPIs
Five KPIs are tracked, ordered by clinical relevance:
- Critical Incident Count
- Mean Emergency Response Time
- Mean Emergency Wait Time
- Mean Medication Wait Time
- Mean Nurse Utilisation
Emergency wait and emergency response time are the same quantity by construction (an emergency is only ever served by the nurse who arrives), so they report identical values throughout, and the tables below collapse them into four distinct rows.
Since five KPIs are tested simultaneously, a step-down Holm–Bonferroni correction controls the family-wise error rate at 0.05. Cohen's measures effect size, and a percentile bootstrap (10,000 resamples) acts as a distribution-agnostic cross-check on every mean difference.
Descriptive Analysis
Descriptive analysis reports the marginal distribution of each KPI under each scenario, exposing heterogeneity across replications.
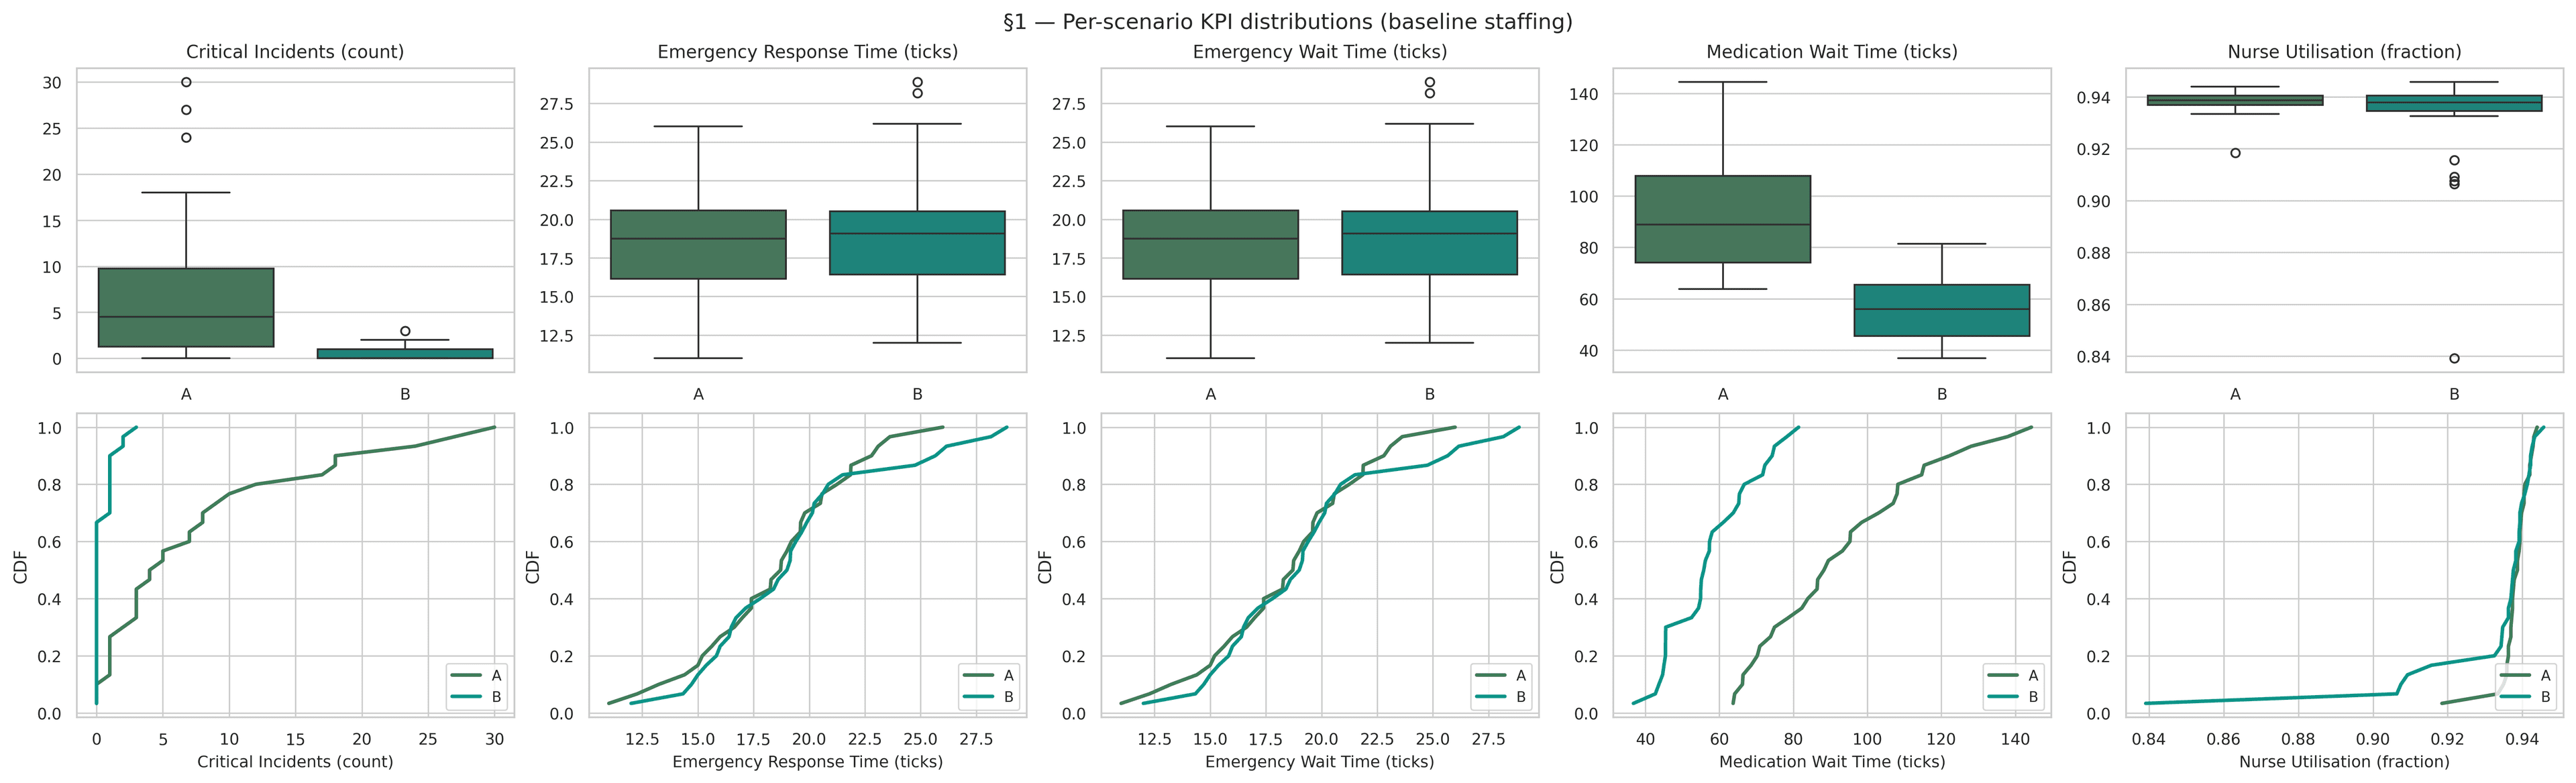
| KPI | Scenario | Mean | Std | Min | Max | Median |
|---|---|---|---|---|---|---|
| Critical Incidents | A | 7.733 | 8.358 | 0 | 30 | 4.500 |
| Critical Incidents | B | 0.467 | 0.776 | 0 | 3 | 0.000 |
| Emergency Resp. Time | A | 18.466 | 3.479 | 11.000 | 26.000 | 18.732 |
| Emergency Resp. Time | B | 19.268 | 4.093 | 12.000 | 28.875 | 19.071 |
| Medication Wait Time | A | 92.871 | 22.314 | 63.723 | 144.355 | 88.874 |
| Medication Wait Time | B | 57.543 | 11.842 | 36.771 | 81.438 | 55.999 |
| Nurse Utilisation | A | 0.938 | 0.005 | 0.918 | 0.944 | 0.939 |
| Nurse Utilisation | B | 0.932 | 0.020 | 0.839 | 0.946 | 0.938 |
Three features stand out.
First, the critical-incident distribution under Scenario A is strongly right-skewed: a median of 4.5, but a maximum of 30 incidents in a single shift. Under Scenario B the distribution collapses toward zero: median 0, maximum 3.
Second, emergency response and wait time are nearly indistinguishable between scenarios. The CDFs overlap almost completely.
Third, medication wait time shows a clean shift of the entire distribution. Scenario B's upper quartile sits below Scenario A's lower quartile. Nurse utilisation is essentially unchanged, though Scenario B shows a wider spread ( rises from 0.005 to 0.020), reflecting cases where robots briefly idle nurses between tasks.
Comparative Analysis
Because seeds are held in common across scenarios, each replication in A pairs with the replication in B driven by the same patient-arrival sequence. The paired -test on is therefore the primary inference.
| KPI | Mean Diff | Paired | Cohen's | Bootstrap 95% CI | Sig. | |
|---|---|---|---|---|---|---|
| Critical Incidents | 7.267 | 4.905 | 0.895 | [4.600, 10.300] | 0.0001 | ✓ |
| Medication Wait Time | 35.327 | 7.867 | 1.436 | [26.814, 44.177] | < 0.0001 | ✓ |
| Emergency Resp. Time | −0.802 | −0.743 | −0.136 | [−2.860, 1.288] | 0.9272 | |
| Nurse Utilisation | 0.007 | 2.030 | 0.371 | [0.001, 0.013] | 0.1549 |
Two KPIs improve substantially, with effect sizes above 0.8 and bootstrap intervals comfortably clear of zero. In ward terms: a median shift goes from four or five patients deteriorating to a critical event down to none at all, and the average patient waits ~29 minutes for medication instead of ~46.
The two null results are as informative as the two wins.
Emergency response time does not improve (raw , ). This is correct by construction: emergencies are nurse-only, and nurses do not abandon a patient mid-task, so a nurse already occupied with a medication round is unavailable whether or not a robot exists. A significant result here would have signalled a bug in the model.
Nurse utilisation does not fall (). Robots do not give nurses an easier shift; the emergency channel is nurse-only and need arrival rates drive the nurse schedule regardless. What changes is what nurses spend the shift doing, not how much they do. That is a materially different claim from the one a robotics vendor would make, and the model is what lets us tell the two apart.
Sensitivity Analysis
The factorial data reveals which staffing factor matters most for each KPI, and, critically for generalisability, how the value of each robot type depends on nurse count. The OAT sweeps probe the response surface along the load dimensions.
We fit an OLS regression of each KPI on all four staffing factors, with factors centred and unit-variance standardised so coefficients are directly comparable within a KPI.

| KPI | NURSE_COUNT | MEDI_COUNT | BLANKI_COUNT | EDI_COUNT |
|---|---|---|---|---|
| Critical Incidents (count) | −19.122 | −11.076 | −3.616 | −4.382 |
| Emergency Response Time (ticks) | −3.305 | −0.398 | −0.254 | −0.333 |
| Medication Wait Time (ticks) | −50.234 | −26.633 | 0.182 (p = 0.78) | −7.987 |
| Nurse Utilisation (fraction) | −0.035 | −0.015 | −0.008 | −0.009 |
Three patterns emerge.
Nurse count dominates every KPI. Its standardised effect is roughly twice MEDi's on critical incidents and medication wait, and five to ten times larger on emergency response time and utilisation. No robot configuration substitutes for adequate nursing.
MEDi is the second-strongest factor on the two KPIs robots can plausibly influence, confirming the intended mechanism: faster medication delivery prevents patient health from draining to zero.
BLANKi has no detectable effect on medication wait (coefficient 0.18, ), as it shouldn't, since it never touches a vial. It does contribute measurably to critical-incident reduction (−3.6), consistent with unfulfilled comfort needs driving their own slower health drain. A model that had "found" a medication effect for the blanket robot would have been telling us something was wrong with the model.
Nurse × MEDi Interaction
Main-effect coefficients average across the other factors, which hides the thing a procurement committee actually needs. The nurse × MEDi heatmap, sliced at BLANKi = EDi = 1, is the most important figure in the project.
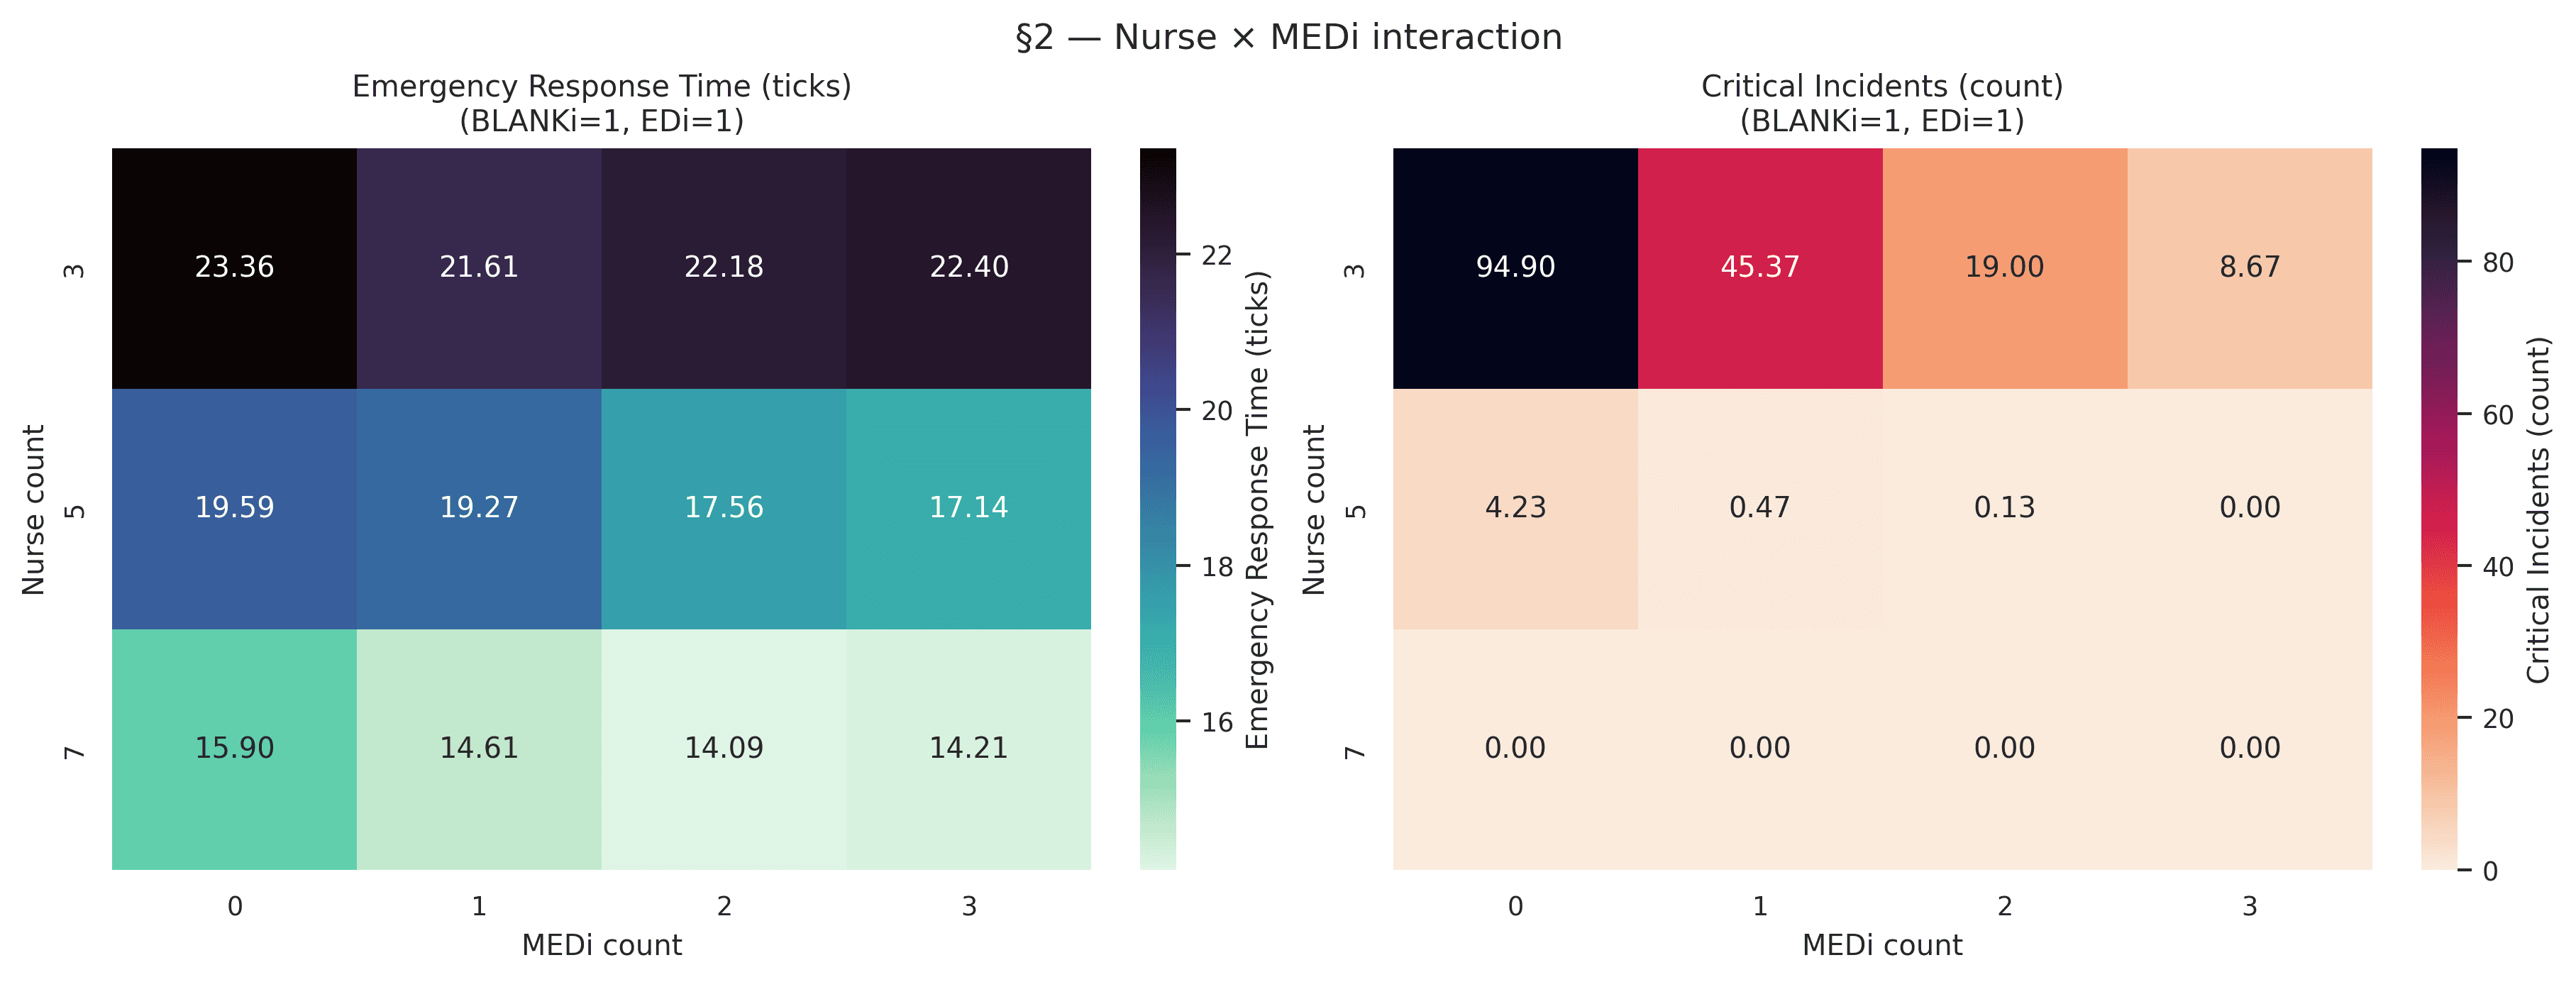
At three nurses, adding MEDi transforms the ward: incidents per shift as MEDi goes from 0 to 3. The first robot alone halves the count.
At five nurses, the ward is already close to safe (4.23 incidents with no MEDi), and a single MEDi drops this to 0.47, below one patient-safety event per shift.
At seven nurses, the ward records zero critical incidents regardless of MEDi count.
Robots are therefore transformative under low staffing, modestly helpful at moderate staffing, and redundant at high staffing. This is the central finding, and it is the one that should drive any deployment decision at a new site.
Emergency response time shows a much weaker but directionally consistent pattern. It is principally a function of nurse count (23 ticks at versus 14 at ) and only marginally improved by MEDi (≈ 0.3 ticks per robot at ), which is expected, since MEDi cannot respond to an emergency and can only shorten response time indirectly, by having freed a nurse from a medication errand in advance.
Wait Time vs. Total Robot Fleet
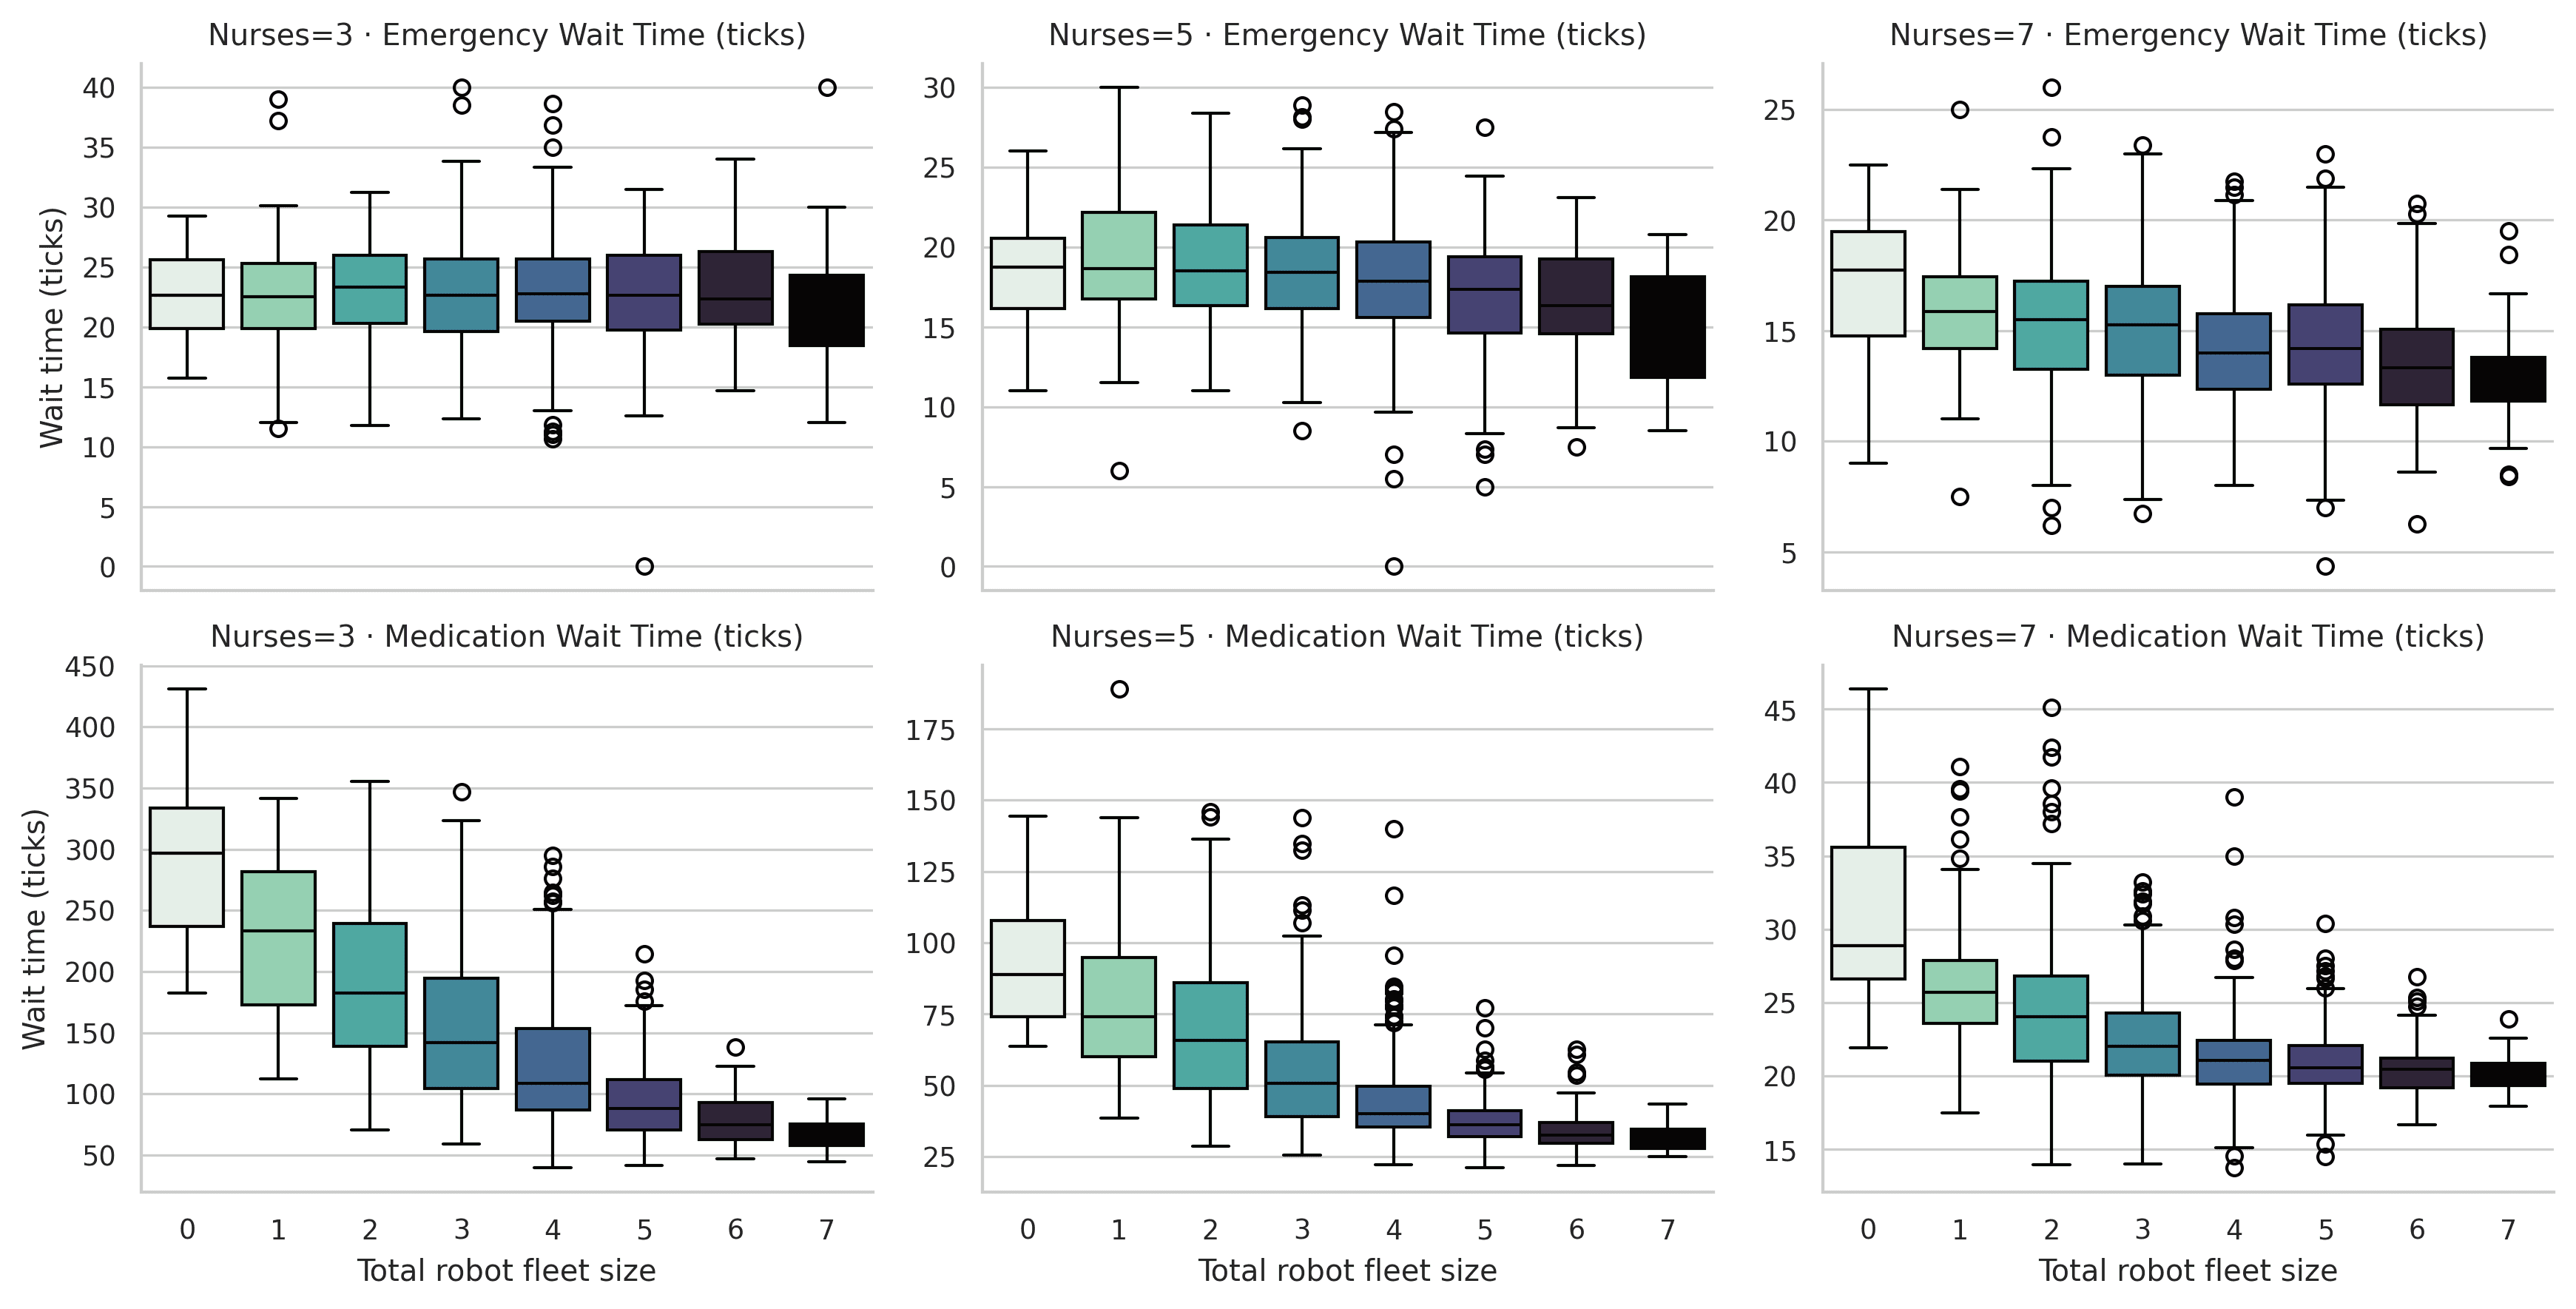
The same staffing-conditioned pattern holds on the wait-time side. Medication wait at three nurses falls from around 300 ticks with zero robots to under 100 with a fleet of seven. At seven nurses it is near-flat, 20 to 40 ticks across every fleet size. Emergency wait time decreases mildly with fleet size at every staffing level, but never by more than a few ticks.
OAT Load Sensitivity
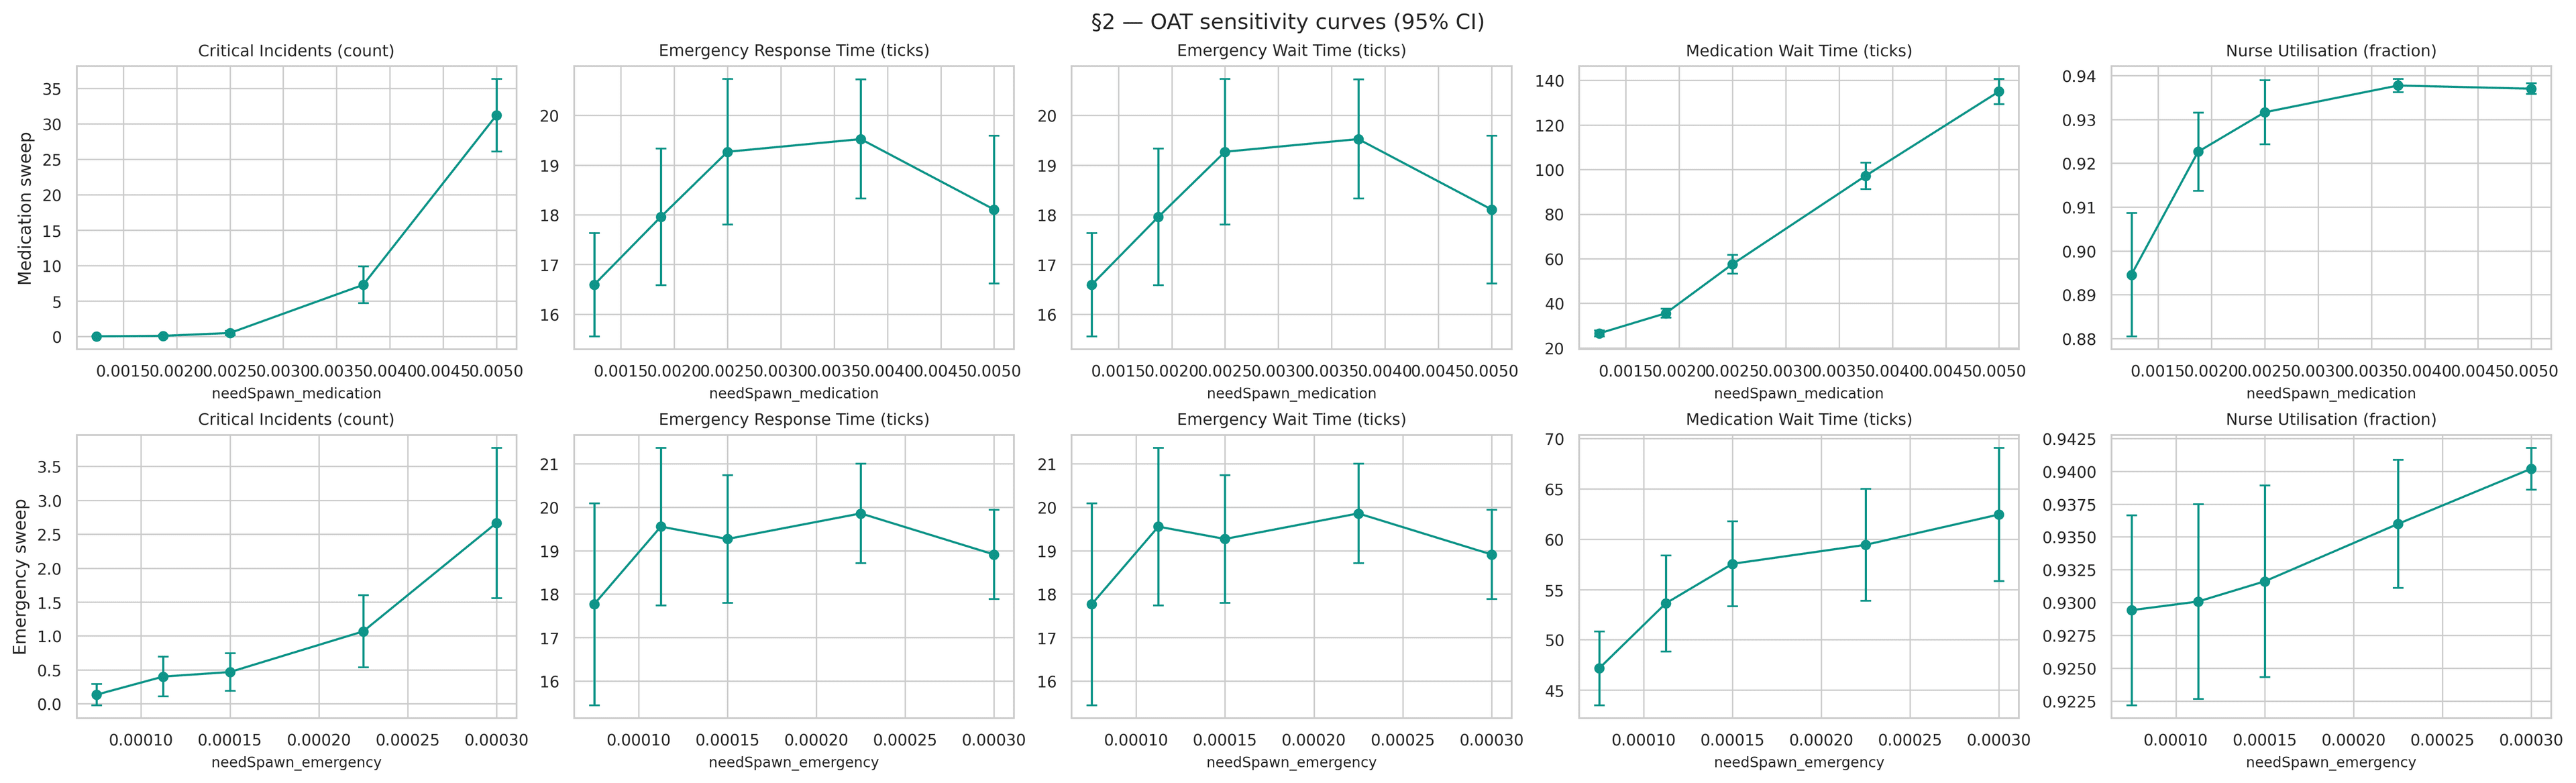
Doubling the medication spawn rate drives critical incidents from near-zero to ≈ 30 per shift and pushes medication wait from ≈ 25 to ≈ 135 ticks. Nurse utilisation saturates near 0.94; the ward is at maximum nurse capacity under heavy medication demand.
Doubling the emergency spawn rate has a far smaller effect: critical incidents rise only from ≈ 0.5 to ≈ 3, and emergency wait and nurse utilisation stay broadly flat until the highest level.
The asymmetry is the useful finding. Under these service-time parameters the medication channel, not the emergency channel, is the binding constraint on patient safety. A hospital with heavier medication demand than our calibration should therefore expect more value from MEDi, not less, which turns a model output into a transferable deployment rule.
Sensitivity Conclusions
Ranked by importance to the patient-safety KPI:
NURSE_COUNTMEDI_COUNT: strong, and conditional on nurse count- Medication spawn rate: a strong modulator of the required fleet size
EDI_COUNT,BLANKI_COUNT- Emergency spawn rate
For the remaining KPIs the ranking is qualitatively similar, but with NURSE_COUNT even more dominant.
Steady-State vs. Non-Steady-State
A Terminating Simulation
A hospital shift has a defined start and end. There is no long-run steady state to average over: real wards have shifting arrival patterns, handovers, and discrete breakpoints that any single eight-hour window samples non-stationarily. Running the model out to 10,000 ticks and applying batch-means analysis would answer a question nobody asked.
The model is therefore terminating, and the analysis uses the method of independent replications: many short runs, each simulating one full eight-hour shift from a clean initial state, with KPIs aggregated across the replication ensemble.
Empirical Warm-Up Validation
Terminating or not, the first ticks of each replication contain a transient that is a modelling artefact rather than a property of the real ward: all patients start at full health, the queue is empty, and every nurse is idle at a station. Statistics that include this transient are biased toward the initial condition.
Welch's graphical method identifies where the transient ends. Each per-tick KPI is averaged across replications, smoothed with a centred 25-tick moving window, and inspected for the point at which it enters a ±5% band around its long-run mean.
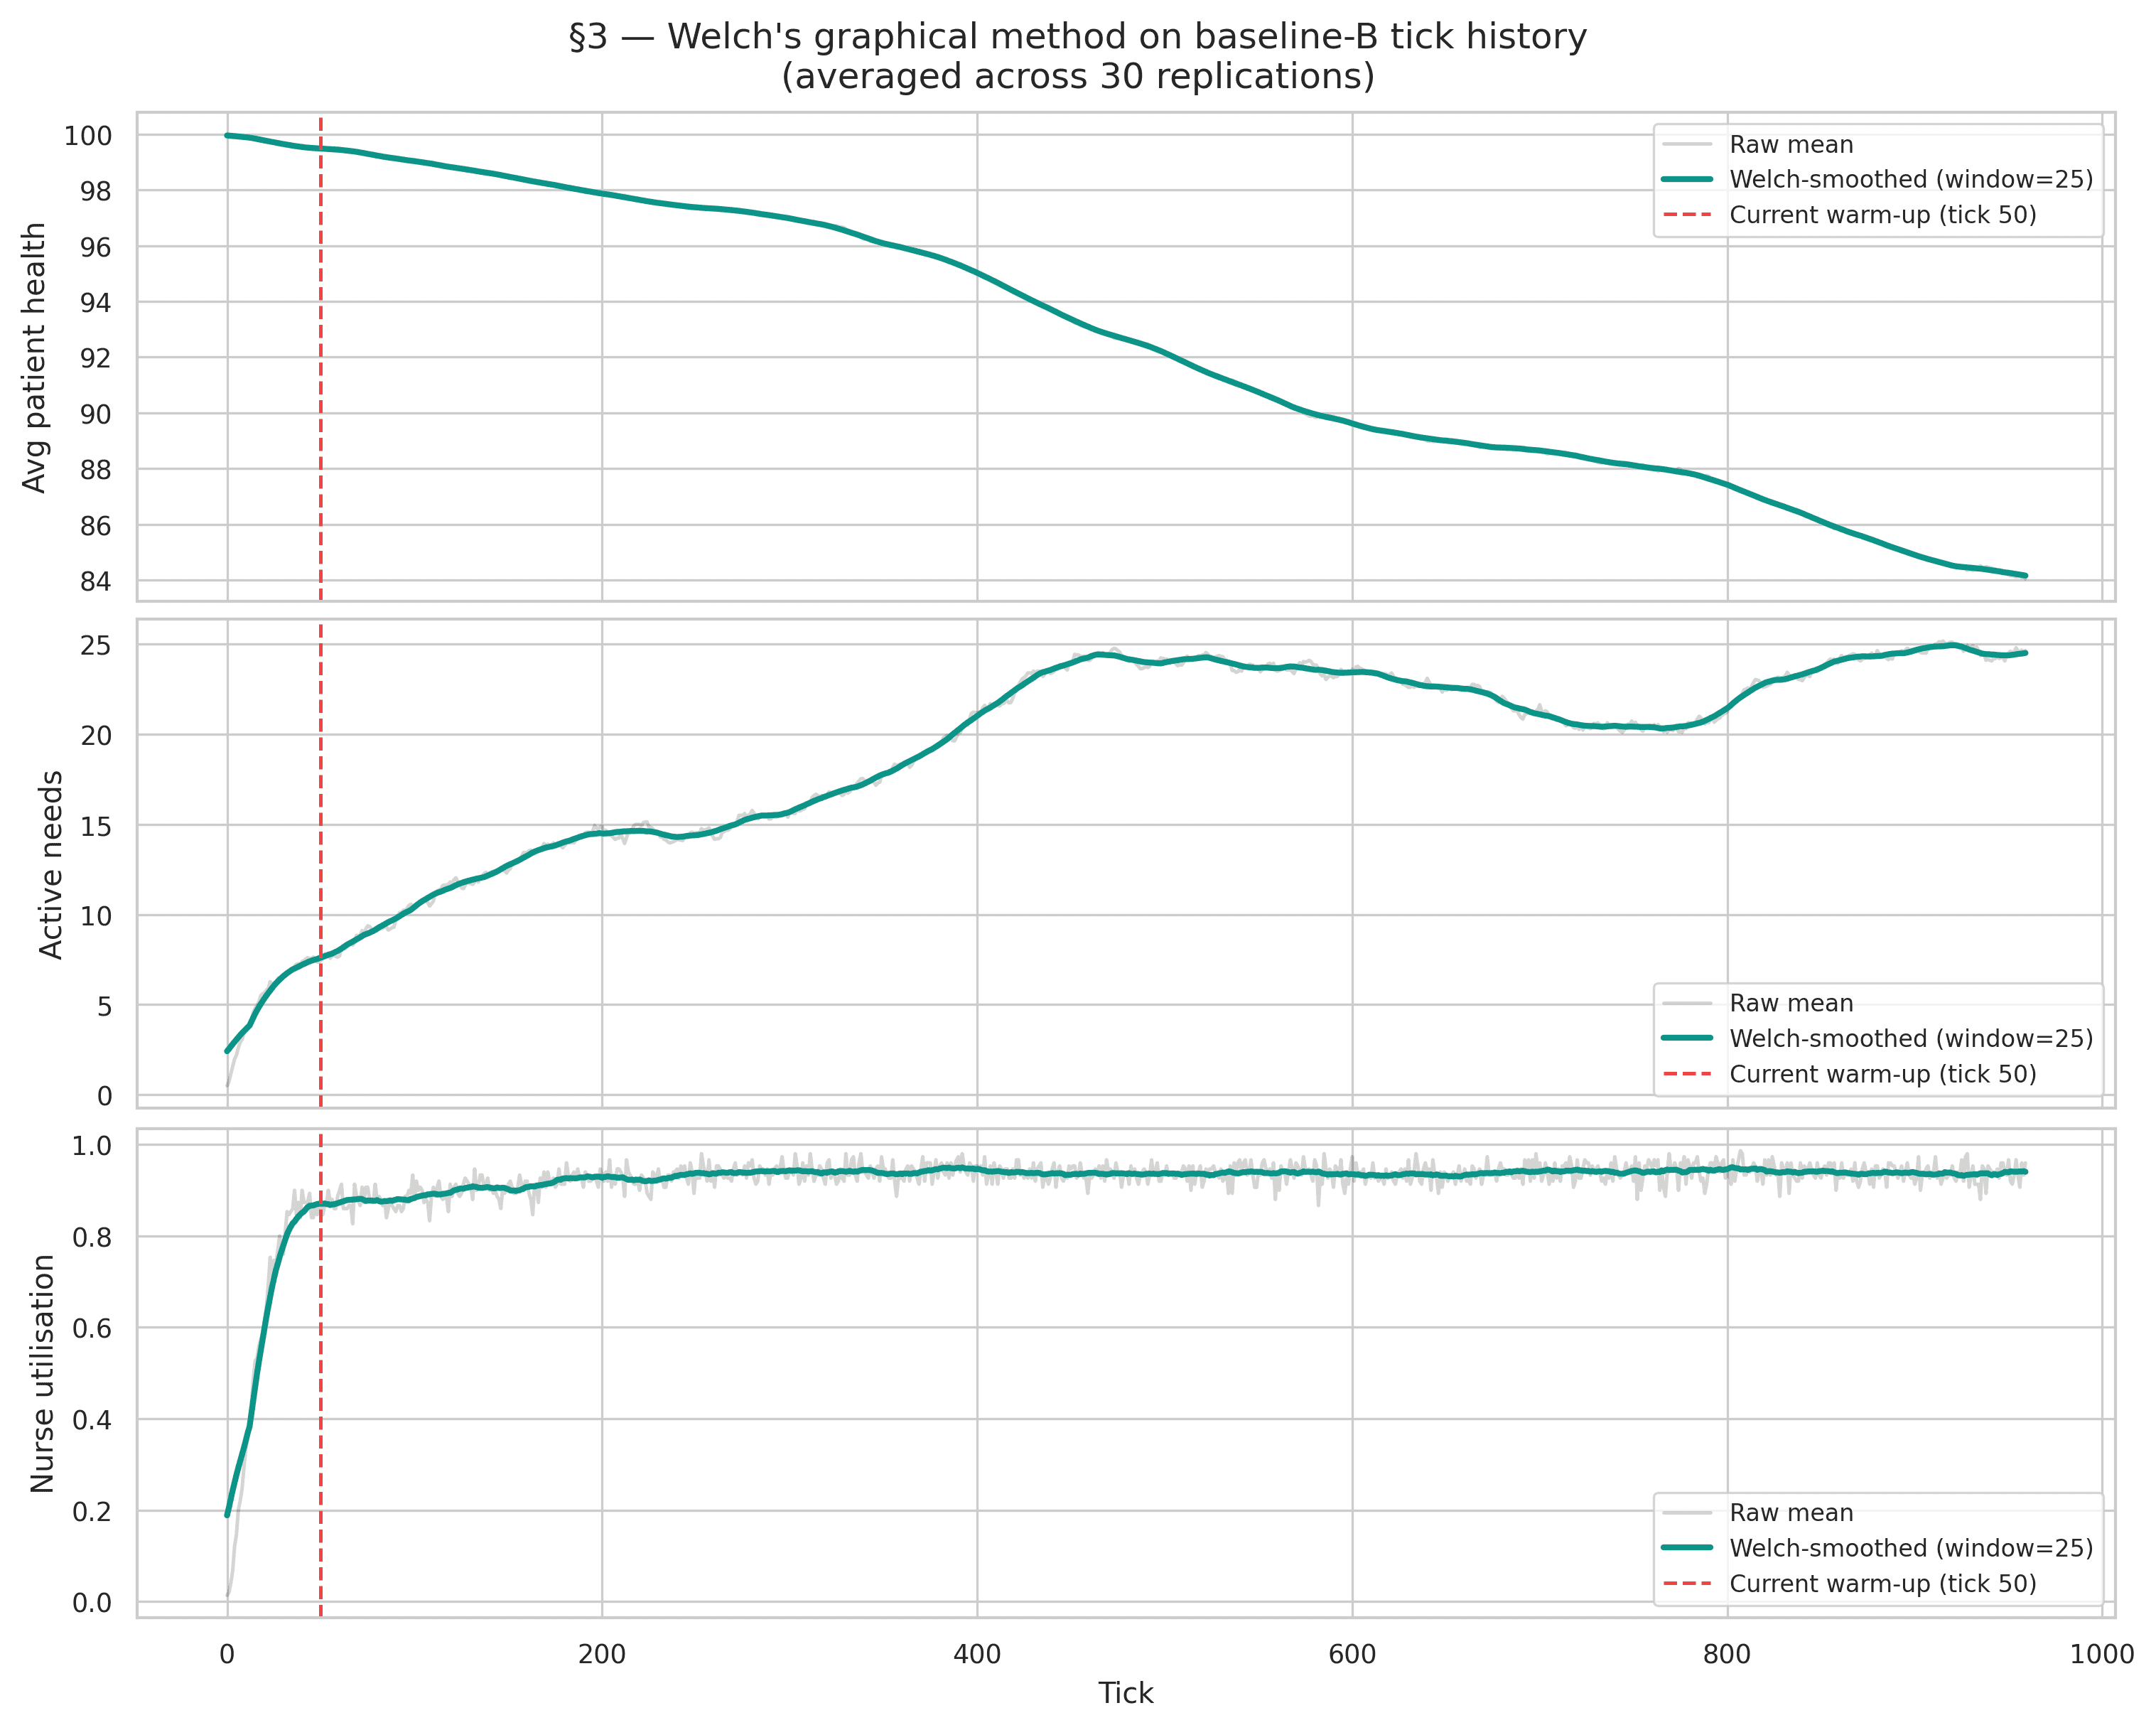
| KPI | Transient ends at tick |
|---|---|
| Nurse utilisation | 109 |
| Avg patient health | 380 |
| Active needs | 390 |
The three KPIs disagree, and the verdict is against us: WARM_UP_TICKS = 50 is roughly eight times too short for the health-derived KPIs.
Worse, and more interesting: average patient health never stabilises at all. It declines monotonically across the shift, which means patients accumulate needs faster than the nurse-plus-robot fleet can close them. There is no stationary regime for that KPI to settle into.
The practical consequence: reported means for active-need count and patient-health-derived quantities are slightly optimistic, since the discarded window was too small to remove the low-activity opening. The A-vs-B comparison survives intact, because both scenarios carry the identical bias and it differences out, but the absolute levels should not be quoted as though they were clean. A follow-up run at WARM_UP_TICKS = 400, or an initial-condition design that seeds the ward with partially-aged needs and partially-drained patients, would remove the transient rather than discard it.
Accuracy of the Sample Mean
Precision and Required Replications
The half-width of a 95% confidence interval is , and the replication count required for absolute precision is:
Evaluated at the Scenario-B baseline with set to 10% of each KPI's own mean:
| KPI | Mean | Std | Rel. Precision | Adequate at n = 30? | |
|---|---|---|---|---|---|
| Critical Incidents | 0.467 | 0.776 | 0.621 | 1,157 | No |
| Emergency Resp. Time | 19.268 | 4.093 | 0.079 | 19 | Yes |
| Medication Wait Time | 57.543 | 11.842 | 0.077 | 18 | Yes |
| Nurse Utilisation | 0.932 | 0.020 | 0.008 | 1 | Yes |
Every KPI clears the bar at 30 replications except the headline one. Scenario B's critical-incident count is heavily zero-inflated, since most shifts record none at all, which inflates the coefficient of variation enormously and pushes to 1,157.
This is worth stating plainly, because it is a distinction that gets elided constantly: 30 replications are more than enough to establish that the effect exists (, Holm ). They are nowhere near enough to pin down how large it is to within 10%. Those are different claims, and only the first one is supported.
Running-Mean Convergence

The running means and their 95% intervals stabilise well before replication 30 for every KPI except critical incidents, whose interval stays wide, which is the same zero-inflation story told graphically.
Generalisability to Other Hospitals
Reading the nurse × MEDi interaction heatmap yields three deployment regimes, defined by nurse-to-bed ratio rather than by hospital.
Under-Staffed Wards
At ≈ 3 nurses per 48 beds, patient-safety outcomes are unacceptable: a mean of 94.9 critical incidents per shift, with essentially every shift experiencing multiple events. One MEDi halves this to 45.4; three cut it by an order of magnitude to 8.7.
But the correct intervention at this staffing level is to hire nurses, with robots as a secondary layer. The factorial is unambiguous that no fleet substitutes for the missing headcount, and a model that recommended a robot purchase here would be laundering a staffing failure into a procurement decision.
Baseline-Staffed Wards
At ≈ 5 nurses per 48 beds, matching the calibrated baseline, a single MEDi drops critical incidents from 4.23 to 0.47 per shift and medication wait from 93 to 58 ticks, a 38% reduction.
This is the regime where the business case is strongest. The safety ceiling is already close, so the robots deliver mainly operational gains: faster medication turnaround and better patient experience on comfort and escort needs.
Well-Staffed Wards
At ≈ 7 nurses per 48 beds, critical incidents are already essentially zero. Wait times improve only marginally under any robot configuration, and nurse utilisation falls by 1–2 percentage points. Deployment is not recommended at this staffing level, unless secondary objectives such as reducing nurse walking distance or standardising medication handling are explicitly valued.
Limitations
- Single ward layout. The 20 × 15 grid with 48 beds, 4 nurse stations, 3 charging bays and 1 entrance is a plausible abstraction, not a real floor plan. Travel-time effects are sensitive to topology, and a materially different layout could shift MEDi's effectiveness.
- No collision or queueing. Agents share cells freely, so travel times are a lower bound. Corridor congestion is precisely the failure mode one would expect when scaling a fleet, and this model cannot see it.
- Single shift pattern. Every replication runs one eight-hour shift from a reset initial condition. Handovers, fatigue accumulation, and overnight low-demand periods are not modelled.
- Warm-up shorter than recommended.
WARM_UP_TICKS = 50is insufficient for health-derived KPIs, so aggregates mix in some transient-phase data. The bias runs toward optimism, but the direction of the A-vs-B comparison is unaffected because both scenarios share it. - No cost model. Every conclusion here is operational. A real procurement decision needs capital and operating cost per robot weighed against nurse-hours saved and adverse events averted.
Conclusion
The simulation supports a conditional recommendation. A service-robot fleet produces substantial patient-safety and operational improvements in wards that are under- or moderately staffed for their medication load, and delivers diminishing returns at well-staffed saturation.
The finding a hospital would actually act on is therefore not "buy robots." It is: audit your nurse-to-bed ratio and your medication demand first, because those two numbers determine whether a robot fleet is transformative, marginal, or a waste of capital, and the model will tell you which regime you are in before the money is spent.