Highlights
- Developed a mixed-integer linear program to solve a multi-objective optimisation problem.
- The model was solved using Julia, particularly by using JuMP and GLPK as the solver.
GitHub - nathanansel28/40.002-Optimisation-1D
Contribute to nathanansel28/40.002-Optimisation-1D development by creating an account on GitHub.
github.com
Project Background
Protein deficiency and poverty in the Philippines is an alarming issue, especially among children and pregnant women. Limited access to protein-rich food contributes to malnutrition and stunted growth, affecting health and development while also worsening poverty in the long term. To tackle this issue, citizens of the Philippines have focused on catching fish as one of the ways to provide a more affordable source of protein. However, overfishing and inefficient resource allocation have compromised the steady and reliable supply of fish—and with it, protein—while also worsening the economic security of the people.
💡 Thus, this project strives to create a Mixed Integer Linear Program (MILP) to address this issue. Our MILP is designed to find an optimal strategy to catch and distribute fish among the people so as to maximize the overall protein distribution while minimizing all associated costs.
Model Formulation
The Philippines is one of the world's biggest archipelagos: it is made up of multiple islands interconnected by sea. As such, the Philippines is blessed with abundant natural resources from the sea, namely fish. However, a major challenge is posed in that this fish is not directly accessible to the people. For an ordinary person to consume fish, fish must be distributed through an intricate supply chain involving, from the very beginning, a fishing ground, and then a processing facility, and finally a city from where a person can directly buy fish. Consider the following diagram to illustrate this supply chain.
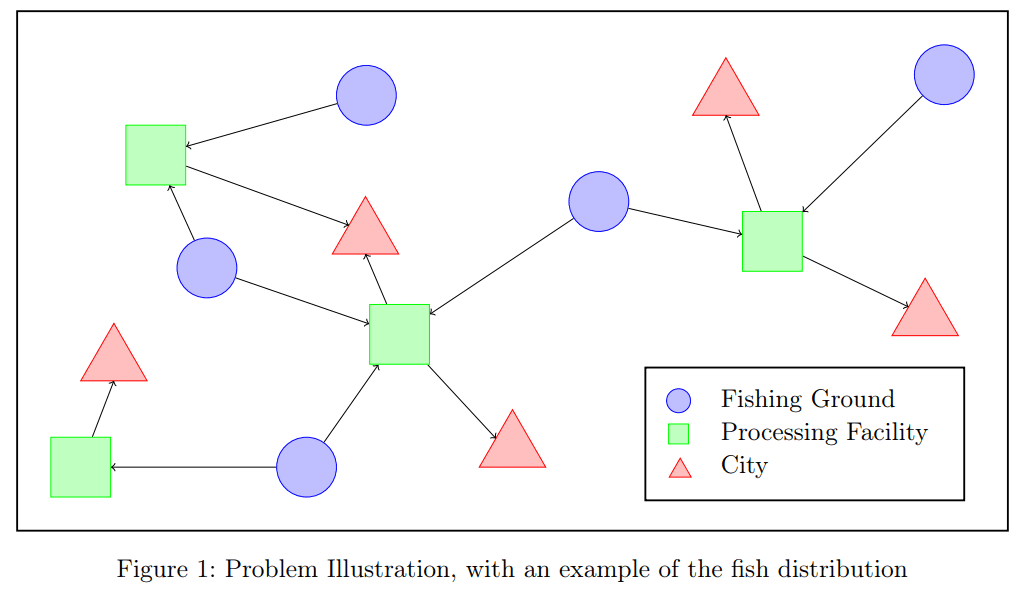
A major challenge faced in the fisheries industry is thus deciding how to distribute fish in the most logistically efficient manner. Evidently, there are various geographical obstacles that separate the ordinary fish consumer from the fishing grounds—be it sea or land or even other obstacles—and hence the goal of this project would to be figure out an optimal strategy to distribute the most amount of fish while incurring the least amount of cost possible.
The problem thus centers around: (1) finding the optimal number of fish to be delivered from a fishing ground to a processing facility, (2) finding the optimal number of fish to be delivered from a processing facility to a city, (3) finding the optimal combination of facilities to be opened to ensure adequate fish processing capacity, and finally (4) finding the optimal amount of government subsidies required to provide access to fish consumption for the less fortunate—all while ensuring certain constraints are met.
Indeed, this problem is a "Multi-Stage" Capacitated Facility Location Problem: each processing facility is a client to the fishing grounds, and each city is a client to the processing facilities.
Decision Variables
- — amount of fish f, in kg, caught from fishing ground g and sent for processing at facility i in a year.
- — amount of fish f, in kg, sent from facility i to city j in a year.
- — binary: 1 if facility i is open, 0 otherwise.
- — government subsidy for city j, in Philippine Peso (PHP).
Objective Function
The objective combines four components: maximizing total protein distributed, minus the total fishing cost, distribution cost (plus facility operating cost), and subsidy cost.
where is total protein distributed, is total fishing cost, is distribution cost plus facility operating cost, is total subsidies, and is a large weighting constant that prioritizes maximizing protein distribution over minimizing cost — a Big-M-style approach to combining a multi-objective problem into a single linear objective.
Constraints
The model enforces 8 constraint families, several of which encode real domain assumptions rather than generic bounds:
- Non-negativity & integrality — ; .
- Fishing restriction — each fishing ground has a legally mandated annual catch cap per fish species (Philippine fishing law).
- Processing capacity — each facility can process at most its rated annual capacity.
- Protein consumption — every city's population must receive protein within a health-recommended range, derived from Harvard Health Publishing guidance on daily protein intake:
where is the population of city j and is the protein value of fish f. The lower bound assumes only 1/3 of a person's protein comes from fish, since people should draw protein from a diverse diet, not fish alone.
- Distribution capacity — a facility cannot distribute more fish than it received (flow conservation).
- Budget — a city's total fish spending can't exceed 15% of its aggregate GDP (a reasonable annual food-spending ceiling) plus any subsidy received.
- Fish & fishing-ground diversity — no single fish species or fishing ground may account for more than 25% (or less than 2.5%) of total volume, to prevent over-reliance on any one species or overexploitation of any one ground.
- Facility opening — ties the binary to the continuous flow variables: if a facility is closed, it can receive or send zero fish. We used an aggregated big-M formulation here rather than constraining every individual directly, since it requires only constraints instead of — a deliberate choice to keep the solver's constraint count (and thus solve time) manageable.
Data
The model was parameterized with real 2021 data pulled from Philippine government and industry sources: the Philippines Fisheries Development Authority (PFDA), the Bureau of Fisheries and Aquatic Resources (BFAR), Statista, SimpleMaps, and Payscale, with a few gaps filled via randomization (fishing/transport costs fluctuated ±30% around their base value to simulate real-world variability; city GDP-per-capita was randomized within ±20–30% of the national figure based on each city's administrative status, due to unavailable ground-truth data).
- 7 fish species (Milkfish, Tilapia, Galunggong, Yellowfin Tuna, Indian Mackerel, Skipjack Tuna, Shrimp)
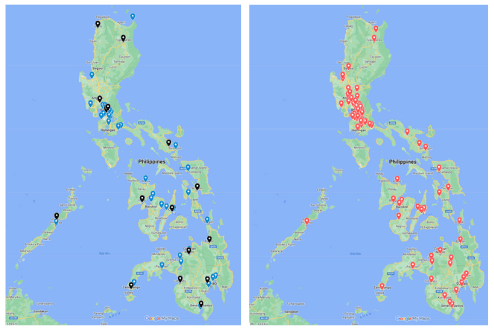
- 16 fishing grounds covering all Philippine seas
- ~55 processing facilities distributed across the islands
- 100 cities — the highest-population cities in the Philippines
- Inter-node distances computed from real coordinates via the Haversine formula in Python
Results
The model was solved to a provably optimal solution using GLPK: , with a 0% relative optimality gap, in about 117 seconds.
Two results stood out as genuinely interesting:
- Every processing facility ended up open ( for all ) — suggesting that, under this model, all facilities considered are worth operating to distribute fish nationally.
- Zero government subsidies were needed ( for all ) — implying that, within the model's assumptions, the fisheries supply chain alone can meet the population's protein needs without further government support.
Limitations
The Big-M weighting on protein maximization () is a modeling convenience, not a principled choice — an arbitrary value for can change which solution is optimal, and large constants can introduce numerical instability for the solver. Determining a more rigorous value (or an alternative multi-objective formulation, e.g. via weighted Pareto optimization) would be a natural next step.
Area Covered
Area Covered — Google My Maps
google.com